
How to Identify Professional Traders’ Footprints as an Earnings Strategy
They Start Trading While Dark Pool Quiet Accumulation Continues
During Earnings Season, most Retail Traders and Technical Traders are often frustrated because they do not have training on Earnings Strategies that work for their Trading Style. They hear about a stock or a great report and discover that the stock gapped up hugely before they even heard about it. Another example is that they try to enter the stock with an overnight order only to discover that they have been caught up in a huge gap up followed by a run down due to Professional Trader profit taking.
See the candlestick chart example below.
LEARN MORE at TechniTrader.com
There is a better way. If you know what to look for, many times Earnings Runs have Professional Traders’ footprints in the chart before the huge High Frequency Trader (HFT) gap or run up. High Frequency Traders front-run retail orders, as the Order Protection Rule requires that brokers post their customer orders. This rule was intended to protect the Retail Traders from their brokers taking advantage of their orders with wider spreads.
However, it has added the additional risk of HFT predatory systems discovering clusters of orders from Retail Traders who use Social Media Tweets and Twits to choose stocks. They also will use a “most popular stocks list” from charting software companies and brokerage firms. Both of these methods of choosing stocks add additional risk to the trade. When there are sufficient numbers of Cluster Orders from Retail Traders, High Frequency Traders automatically trigger, gapping or running the stock up within the first minute of the day.
The advantage StockCharts.com Users have is learning to read the charts to find the Professional Traders’ footprints before the High Frequency Traders gap that stock.
LEARN MORE at TechniTrader.com
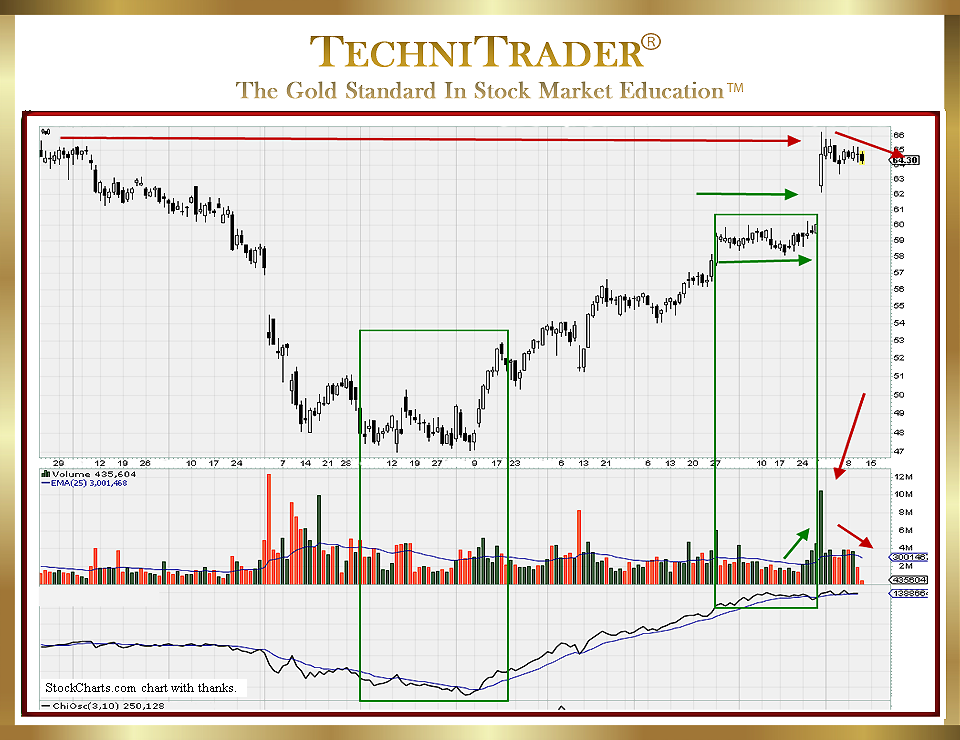
The candlestick chart is a prime example of Professional Traders’ footprints clearly evident before the stock gaps on a High Frequency Trader stock volume spike.
Professional Traders moved in after they discovered Dark Pool Quiet Accumulation, which is a liquidity draw that is sufficiently large enough that they are alerted and start trading while the accumulation continues.
Controlled and bracketed orders maintain the level of price within a range for a while. Stock volume increases as more Professional Traders see the liquidity draw and move in ahead of news or High Frequency Trader gaps. By studying and using indicators designed to reveal Professional Traders’ activity, Retail Traders can enter a stock ahead of a huge gap or run and then take profits as the Professional Traders take profits and other Smaller Lots chase.
The candlestick chart example above is a classic Dark Pool Quiet Accumulation before a Professional Trader pre-momentum run. Then, there is a High Frequency Trader gap with Smaller Funds and Retail Traders chasing in the end.
Summary
Earnings Strategies with simple setups and Professional Traders’ footprints guide traders as to when to enter a stock or option before the High Frequency Traders get there.
To be a highly profitable trader, you need to incorporate indicators, Relational Technical Analysis™, and other skills of reading a chart to enhance what you are already doing. By increasing your awareness of who is creating that price and stock volume pattern on the chart, you take your technical skills to a much higher level of sophistication. Instead of trading Technical Analysis using the basics of beginners and novices, learning to read charts like a Professional Trader will improve your success rate.
LEARN MORE at TechniTrader.com
If you have not yet begun to trade or invest, go to Introduction: Learn How to Trade Stocks – Free Video Lesson to get started.
Learn the steps to trade like a pro with this introductory mini course. You will learn what it takes to create a Professional Trading Plan that can help you achieve your trading goals: How to Create a Professional Trading Plan
Trade Wisely,
Martha Stokes CMT
TechniTrader technical analysis using a StockCharts chart, courtesy of StockCharts.com
Chartered Market Technician
Instructor & Developer of TechniTrader Stock & Option Courses
Copyright ©2017–2025 Decisions Unlimited, Inc. dba TechniTrader. All rights reserved.
TechniTrader is also a registered trademark of Decisions Unlimited, Inc.