
What Are Opportunities for Huge Profits in Trading ETFs?
They Move Based on Index Value as It Changes
Thousands of new Exchange-Traded Funds (ETFs) have been created over the past few years, providing another way to trade stocks for short-term profits. All ETFs are based on a group of stocks often called an index. Often, the most popular ETF among traders is the DIA or Dow Jones Industrial Average.
Trading stocks on their earnings release date can be problematic due to High Frequency Traders’ (HFTs’) interference and front-running tactics that can reverse a stock within a couple of minutes. However, using an ETF can be far lower-risk with much higher profit potential.
Chart example #1 below has been sideways with heavy selling over prior weeks. At this point, the candlesticks do not reflect whether it will break out to the upside or the downside when the sideways market correction ends. Selling pressure is high, and Price Indicators are likely to reflect this pressure.
LEARN MORE at TechniTrader.com
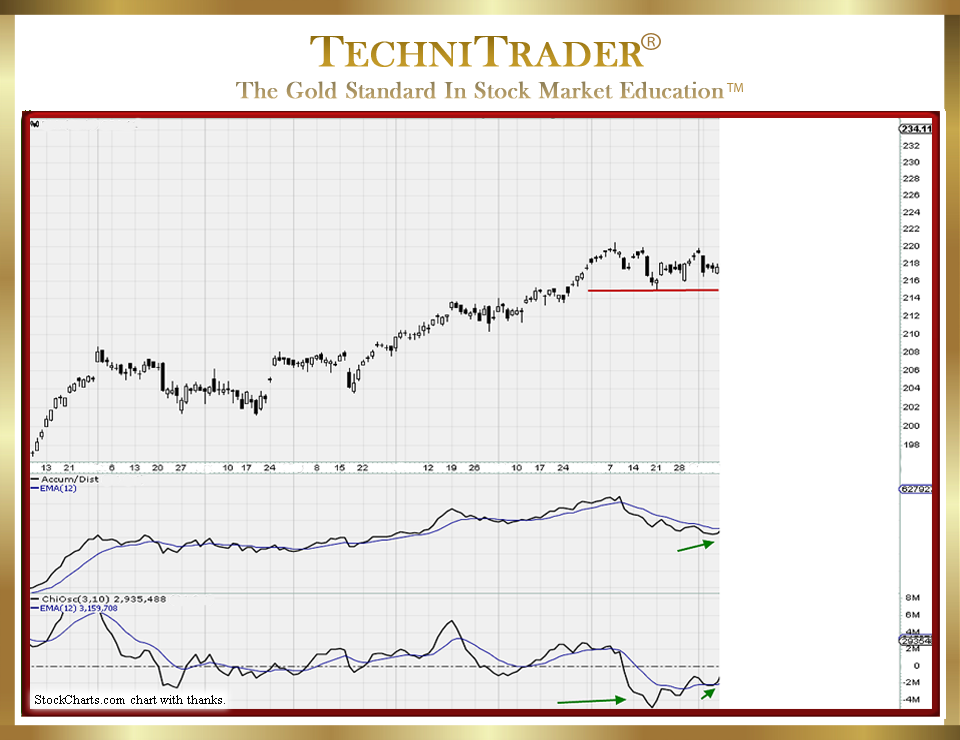
However, the stock Volume Indicator and Accum/Dist Large-Lot Indicators reveal that the larger lots are on the buy side and not the sell side. This indicates an upside energy coming from the underlying index AND from DIA ETF buyers. Those buyers are predominantly giant Buy Side Institutions using Dark Pools and Professional Traders. This gives you the vital information of where the heaviest concentration of large-lot activity is at this moment in time on this ETF chart.
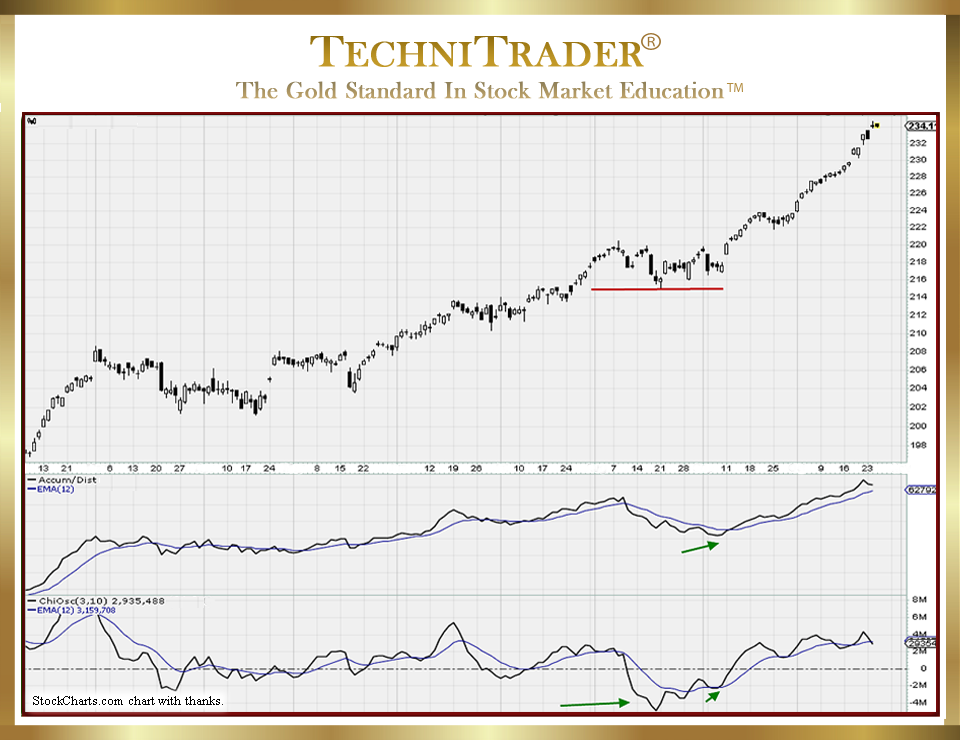
This ETF breaks out to the upside as the Dow Jones Industrial Average runs up out of its sideways candlestick pattern. See chart example #2 below.
LEARN MORE at TechniTrader.com
The secret to trading an ETF is to follow its underlying index, as they will always closely match. At the very end of each month, the trusts that hold the basket of underlying stocks for an ETF are adjusted to maintain the integrity of the index value to the ETF value.
Understanding that an ETF does not move based on supply and demand activity but on the index value as it changes is the first step to successful ETF trading.
ETFs provide investors with an easier way to invest in a specific index or emerging market, debt security, or even currencies without the hassle and time to learn each different financial market.
There are Exchange-Traded Derivatives (ETDs) for every financial market. Even Options now have ETFs based on the Stock Option or Index Option. So, even low capital base traders can profit from ETFs. If you want an easier way to trade currencies, commodities, emerging markets, foreign country indexes, or a specialty industry such as biotechnology, then ETFs make the entire process straightforward and easy.
What you need to remember is that the ETF is not running up on the basis of demand. So, indicators must be adjusted and adapted to this different reality of supply and demand equations and theories.
The ETF is a value, not a price. In addition, since the ETF moves up based on its underlying components in the index, using Stock Price Indicators will not provide the analysis needed to identify potential momentum runs prior to a huge gain for the ETF.
Summary
Incorporating the stock Volume, Accum/Dist, and Flow of Funds indicators and stock Volume Oscillators into your ETF Indicators will help you determine the breakout direction.
Even if you choose to use Bollinger Bands® to identify compression patterns of price, they do not give you the breakout direction. They only reveal that the ETF and its underlying index are poised for a breakout in either direction.
Incorporating these excellent indicators that are part of the StockCharts.com charting software will enable you to determine the breakout direction with far more accuracy. This allows you to enter a stock or option for an ETF with greater confidence and higher profitability.
LEARN MORE at TechniTrader.com
If you have not yet begun to trade or invest, go to Introduction: Learn How to Trade Stocks – Free Video Lesson to get started.
Learn the steps to trade like a pro with this introductory mini course. You will learn what it takes to create a Professional Trading Plan that can help you achieve your trading goals: How to Create a Professional Trading Plan
Trade Wisely,
Martha Stokes CMT
TechniTrader technical analysis using StockCharts charts, courtesy of StockCharts.com
Chartered Market Technician
Instructor & Developer of TechniTrader Stock & Option Courses
Copyright ©2017–2026 Decisions Unlimited, Inc. dba TechniTrader. All rights reserved.
TechniTrader is also a registered trademark of Decisions Unlimited, Inc.