Currently browsing category

StockCharts.com Blog

How to Identify Topping Action with Bollinger Bands®

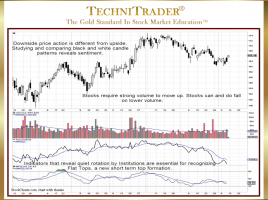
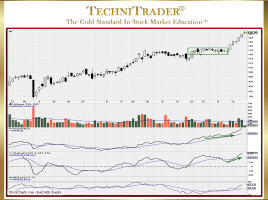
Use Bollinger Bands with Quantity Indicators Bollinger Bands are an outstanding indicator for analyzing sideways candlestick patterns. The bands’ ability to expand and contract revealing the amplitude of price is a critical factor for accurately identifying breakout action before price moves up or down. Use Bollinger Bands topping action to …

Trading the Small Cap Stocks

About Outstanding Shares and Momentum Runs Most Retail Traders only trade big cap stocks. This is because they depend mostly on news for finding stocks to trade. It can also be due to relying upon Industry or Sector selections, often missing out on the underlying stocks that are moving with …

How Does Stock Fundamental Support Form?

By Dark Pool Candlestick Pattern Platforms Fundamental Investors and Traders are the Buy Side Institutions, who use Dark Pools to buy and sell large to giant lots and block orders. Often trading short-term are the Sell Side Institutions and Smaller Funds. Small-Lot Retail Investors are negligible and tend not to …

How to Cope with Volatile Trading Conditions

Find Stocks That Have Compressing Sideways Candlestick Patterns Trading so-called “Volatile Markets” can seem like a daunting task. Many Retail Traders struggle during these phases of trading action and do not recognize how to cope with “Volatile” Trading Conditions. The problem is not that stock price action is “Volatile”, but …

6 pages