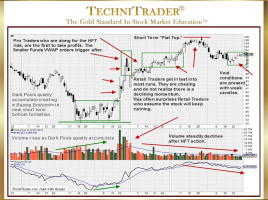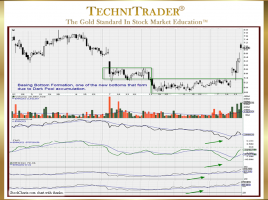
What Are New Bottom Formations for Technical Traders?
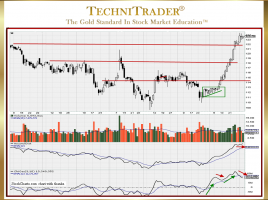
Basing Bottoms Formed by Dark Pool Buy Zones™ One thing that is a constant in the Financial Markets and especially in the Stock Market over the past few years is change. Everything about Technical Analysis is changing. It is often hard for Retail Traders who trade from home and Technical …