Changes to Market Structure Alter Balance of Power Interpretation
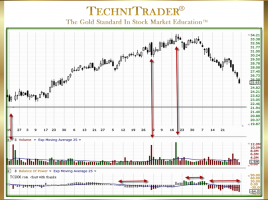
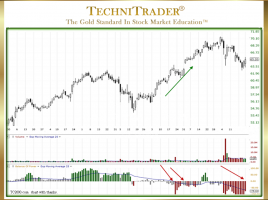
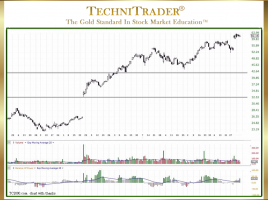
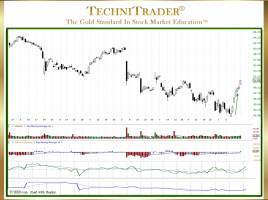
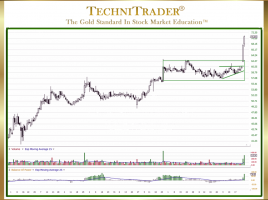
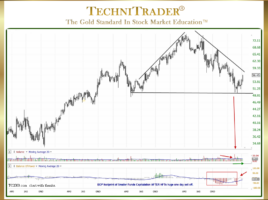
Worden TC2000 Balance of Power the Most Powerful Indicator Ever Written TC2000 Users have a huge advantage over other Retail Traders, as they have the power of Worden Indicators at their disposal. However, recent changes to the Market Structure have altered how traders should interpret these indicators. This discussion is …