Currently browsing tag

Basing Bottom Formation

How to Find Swing Trading Style Runs

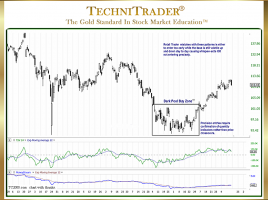
Identify Momentum & Velocity Market Conditions Using Indicators When the Stock Market moves with plenty of momentum and velocity activity, it provides opportunities for Swing Traders to hold a trade through a 1–10 day run up and then exit before the stock encounters profit taking. Below is a stock chart …

What Are New Bottoming Formations in the Stock Market?

Dark Pool Quiet Accumulation Builds Stock Bottoms During Trading Range Market Conditions when several industries are in their own Bear Market while other industries are continuing a Bull Market, determining when a stock has reached a final low or near the final low is critical for Swing Traders. Typically, they …

How to Use Dark Pools for Higher Profits

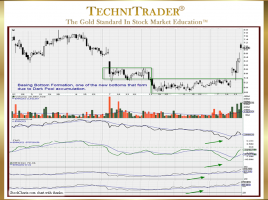
Identify Quiet Accumulation Candlestick Pattern Before Stock Runs An area of Technical Analysis that has not made its way into most Stock Market books, articles, and information available on the internet is how to use Dark Pools for higher profits. The reason why Dark Pool technical patterns aka footprints are …