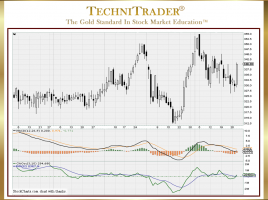
How to Improve MACD Signals for Higher Profits
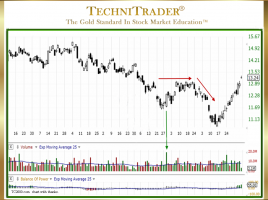
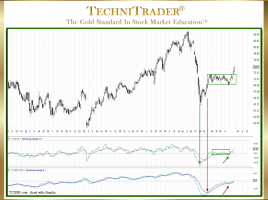
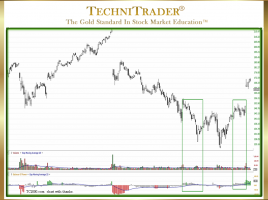
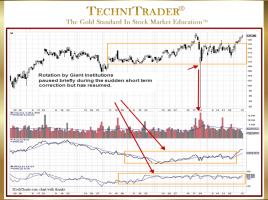
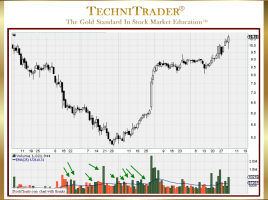
Stock Volume Indicator Reveals Momentum Energy That Has Not Yet Altered Price MACD is the most popular Retail Trader stock indicator; however, it often lags price due to the fact that it is based on moving averages. There is a way to improve the use of MACD for earlier signals …