Currently browsing tag

Market Condition

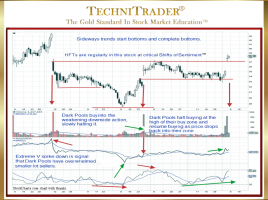
Why Analyze Sideways Bottoming Stock Trends?

To Identify Dark Pool Buy Zones™ The Shift of Sentiment™ pattern in the stock chart example below clearly and easily shows that Buy Side Institutions using Dark Pools entered this stock and would quickly take control of price. Sideways bottoming stock trend analysis of the chart shows that a sudden …

How to Choose Stock Indicators

7 Tips for Selecting Best Indicators for the Stock Market Today Stock Indicators are one of the most useful tools for Individual Investors and Retail Traders. However, choosing the right indicators for your Trading Style and Strategies can be a daunting task. There are over 250 indicators available in the …