How to Identify Selling Short Bounce Areas
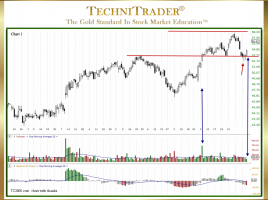
Determine Levels and Strength of Support Topping patterns have undergone dramatic changes in the past decade due to Market Structure changes which have created new types of venues, orders, routing, and Market Participants. Once the new topping formations are identified, the next analysis must be where small and minor non-reversal …