Currently browsing tag

Quiet Rotation

What Is Dark Pool Quiet Rotation™?

Candlestick Patterns Explained with Stock Indicators Most Technical and Retail Traders have heard about Buy Side Institutions’ Dark Pool Quiet Accumulation and Quiet Distribution, but few understand another institutional action which is Dark Pool Quiet ROTATION. The candlestick chart example below with a monthly view shows the commencement of a …

Why Use Stock Volume to Reveal Weak Candlestick Patterns?

How Retail Traders Avoid Whipsaw Trades Many traders still rely solely upon Price and Price Indicators, which leaves them highly vulnerable to whipsaw trades. Stock Volume reveals weak candlestick patterns, and so it is critical to use it in the automated markets today. This is because the giant Buy Side …

Why Use Contrarian Patterns for Stock Top Warning?

Indicators Reveal Giant Institutions Rotating Out as Price Moves Up Often for Beginners, the market reversing and heading down into a correction is a complete surprise or shock. They are not expecting the turn, nor are they prepared for it. Fortunately for Retail Traders, there are plenty of indicators that …

How to Identify Topping Action with Bollinger Bands®

Use Bollinger Bands with Quantity Indicators Bollinger Bands are an outstanding indicator for analyzing sideways candlestick patterns. The bands’ ability to expand and contract revealing the amplitude of price is a critical factor for accurately identifying breakout action before price moves up or down. Use Bollinger Bands topping action to …

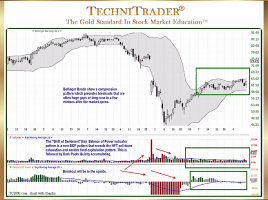
How to Improve Bollinger Bands®

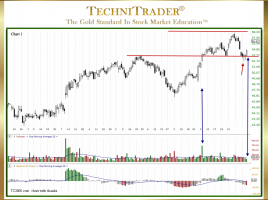
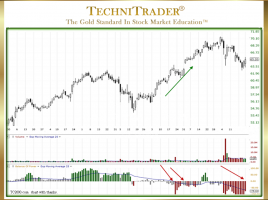
Add Quantity Indicators to Analysis for Stock & Options Trading One of the most exasperating things that happen to Retail Traders and Technical Traders is to find a chart with a perfect setup but the stock has already gapped or ran up with a huge one-day gain, as High Frequency …

2 pages