Currently browsing tag

resistance

How to Position Trade Bottoming Stocks

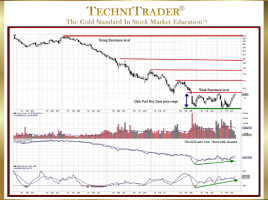
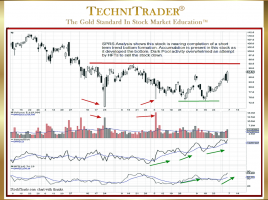
List of 5 What to Recognize in Candlestick Patterns Many traders do not have the time or resources to trade the most well-known Trading Styles, which are Day Trading and Swing Trading. Both of these styles require more time, a higher capital base, and the ability to be trading in …

Why Is the Weekly Chart View Invaluable?

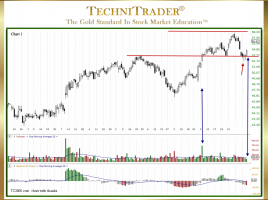
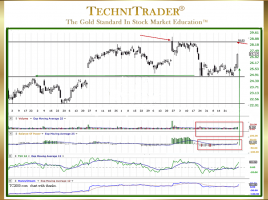
For Interpreting What Price Will Do After Stock Volume Spikes The chart example below with a Daily Chart View shows that High Frequency Traders (HFTs) caused a huge white candlestick and stock Volume spike, as indicated by the vertical red line on the right. Since then, this stock has been …

How to Analyze Stock Support and Resistance

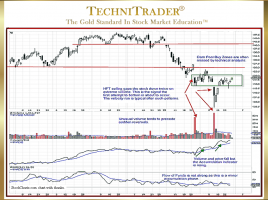
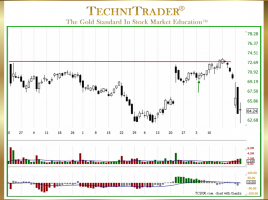
Comparing Price Action with Leading Indicators During a downtrend, traders need to be able to determine if a big white candlestick is a true Reversal back to an uptrending pattern or if it is just momentary Rebound price action caused by Buy the Dip Investors and Buy to Cover Traders. …

How to Exit Stocks at Correct Technical Level

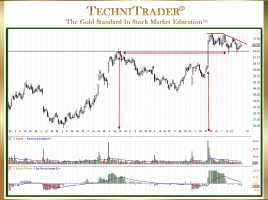
Identify Resistance Where Professional Traders Would Start Taking Profits Most of the time, Retail Traders are focused on finding stocks to trade. However, they spend scant time on assessing risk, proper stop loss placement, trailing profit stops, and determining when to exit the trade, especially as a stock goes ballistic. …

What Are Spatial Pattern Recognition Skills™?

Reading Stock Charts Like the Professional Traders All Technical Traders need to have very high visual pattern skill development so that they can click through charts quickly and identify patterns that they prefer to trade. Unfortunately for most Retail Traders, this skill is underdeveloped, leaving them to rely too much …

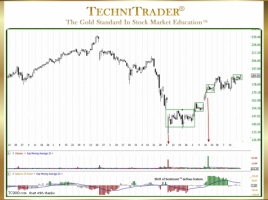
How to Go Beyond Basic Candlestick Pattern Analysis

Recognizing Who Is Controlling the Stock Price There is a plethora of analysis training on Candlestick Patterns and interpretation, and yet this remains one of the most problematic areas for Technical Traders who want to trade at the expert level earning high income from just trading stocks. The candlestick chart …

Why Use Stock Volume to Reveal Weak Candlestick Patterns?

How Retail Traders Avoid Whipsaw Trades Many traders still rely solely upon Price and Price Indicators, which leaves them highly vulnerable to whipsaw trades. Stock Volume reveals weak candlestick patterns, and so it is critical to use it in the automated markets today. This is because the giant Buy Side …