Currently browsing tag

Shift of Sentiment

How to Identify High Frequency Traders and Dark Pools

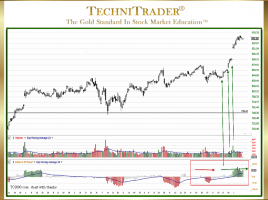
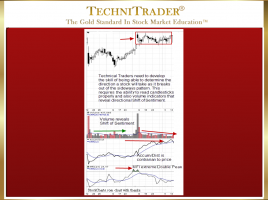
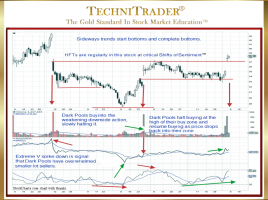
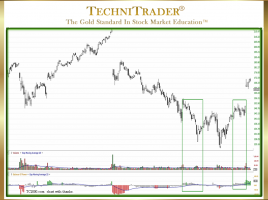
Learn Price and Stock Volume Analysis When the Financial Markets undergo massive internal and structural changes, those changes impact price and stock volume action that Retail Traders depend upon due to their use of charts and technical indicators for stock pick selection and trading. See the candlestick chart example below. …

How to Find Swing Trading Style Runs

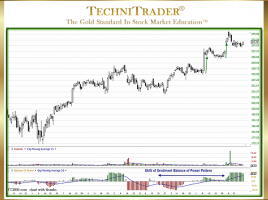
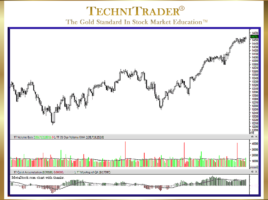
Identify Momentum & Velocity Market Conditions Using Indicators When the Stock Market moves with plenty of momentum and velocity activity, it provides opportunities for Swing Traders to hold a trade through a 1–10 day run up and then exit before the stock encounters profit taking. Below is a stock chart …

How to Cope with Volatile Trading Conditions

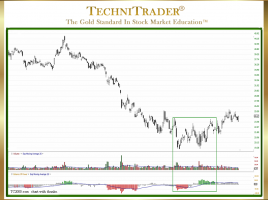
Find Stocks That Have Compressing Sideways Candlestick Patterns Trading so-called “Volatile Markets” can seem like a daunting task. Many Retail Traders struggle during these phases of trading action and do not recognize how to cope with “Volatile” Trading Conditions. The problem is not that stock price action is “Volatile”, but …

Why Use Balance of Power Hybrid Stock Indicator?

So Powerful It Reveals Dark Pools in the Automated Markets There is one critical factor that separates highly successful traders from those who struggle with mediocre returns. It is the awareness of how new Alternative Trading System (ATS) venues, new order processing, and new algorithms have forever changed how stocks …

What Are New Bottoming Formations in the Stock Market?

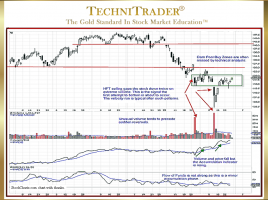
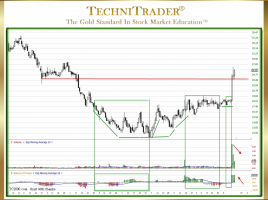
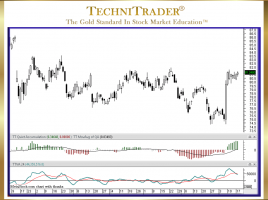
Dark Pool Quiet Accumulation Builds Stock Bottoms During Trading Range Market Conditions when several industries are in their own Bear Market while other industries are continuing a Bull Market, determining when a stock has reached a final low or near the final low is critical for Swing Traders. Typically, they …

2 pages