Currently browsing tag

Shift of Sentiment

How to Go Beyond Basic Candlestick Pattern Analysis

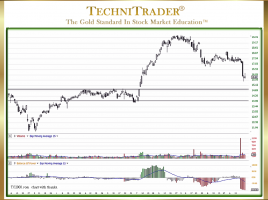
Recognizing Who Is Controlling the Stock Price There is a plethora of analysis training on Candlestick Patterns and interpretation, and yet this remains one of the most problematic areas for Technical Traders who want to trade at the expert level earning high income from just trading stocks. The candlestick chart …

How to Identify Downside Breakouts Prior to a Top

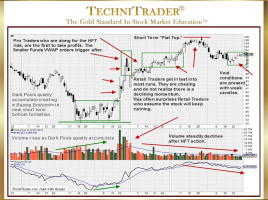
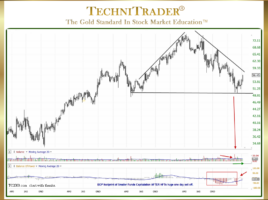
Recognize Shift of Sentiment™ Patterns in Indicators One of the more frustrating patterns for many Technical Traders and Retail Traders are the Flat Top Candlestick Patterns that form today. These new Topping Formations surprise many traders and result in whipsaw trades and losses with breakouts to the downside. What appears …

Why Analyze Sideways Bottoming Stock Trends?

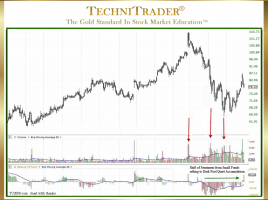
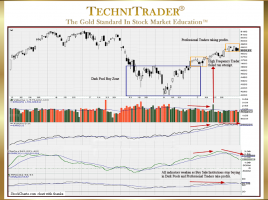
To Identify Dark Pool Buy Zones™ The Shift of Sentiment™ pattern in the stock chart example below clearly and easily shows that Buy Side Institutions using Dark Pools entered this stock and would quickly take control of price. Sideways bottoming stock trend analysis of the chart shows that a sudden …

How to Identify High Frequency Traders and Dark Pools

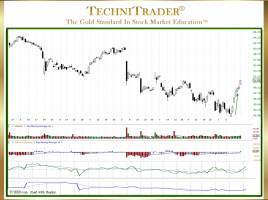
Learn Price and Stock Volume Analysis When the Financial Markets undergo massive internal and structural changes, those changes impact price and stock volume action that Retail Traders depend upon due to their use of charts and technical indicators for stock pick selection and trading. See the candlestick chart example below. …

2 pages