What Are Spatial Pattern Recognition Skills™?
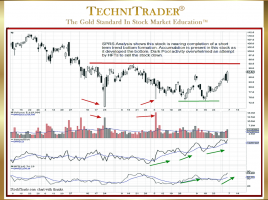
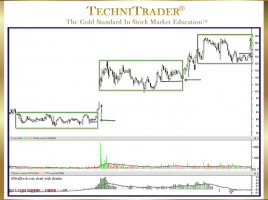
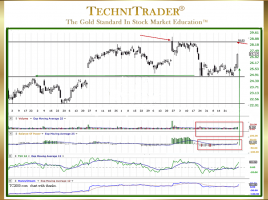
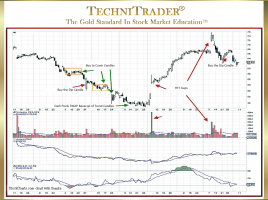
Reading Stock Charts Like the Professional Traders All Technical Traders need to have very high visual pattern skill development so that they can click through charts quickly and identify patterns that they prefer to trade. Unfortunately for most Retail Traders, this skill is underdeveloped, leaving them to rely too much …


