Currently browsing tag

Stock Volume Indicator

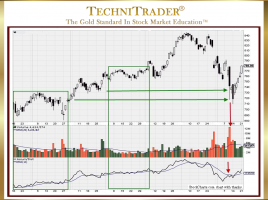
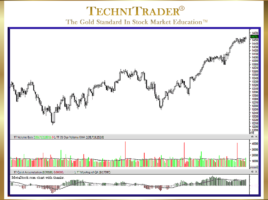
TechniTrader® Hybrid Indicators for MetaStock Users

About TechniCators™ and Market Conditions for Trading or Investing TechniTrader Stock Market Education groups indicators together based on obtaining a complete and thorough analysis of all the Market Data available. These are typically 5 Hybrid Indicators we created. Each group is called a “TechniCator”, and there are TechniCators for each …

How to Improve Bollinger Bands®

Add Quantity Indicators to Analysis for Stock & Options Trading One of the most exasperating things that happen to Retail Traders and Technical Traders is to find a chart with a perfect setup but the stock has already gapped or ran up with a huge one-day gain, as High Frequency …

How to Identify High Frequency Trader Activity

List Provided to Recognize Their Candlestick Patterns High Frequency Trader (HFT) activity occurs often these days, and the HFT candlestick patterns are substantial but unsustainable. Retail Traders who want to learn how to Sell Short during topping markets and downtrends need to be able to identify the “footprints” of the …

Why Learn Dark Pool Candlestick Patterns?

To Enter Stocks Prior to Velocity Runs Dark Pools use precise controlled orders that trigger automatically over extended periods of time. Since the Buy Side Institutions using the Dark Pools are primarily buying for the long term, price can sometimes drop down before moving up. This tendency often leaves Retail …

How to Identify High Frequency Traders and Dark Pools

Learn Price and Stock Volume Analysis When the Financial Markets undergo massive internal and structural changes, those changes impact price and stock volume action that Retail Traders depend upon due to their use of charts and technical indicators for stock pick selection and trading. See the candlestick chart example below. …