Currently browsing tag

Time Segmented Volume

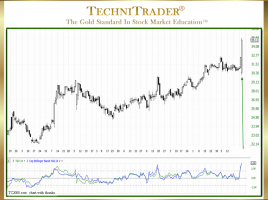
How to Find Swing Trading Style Runs

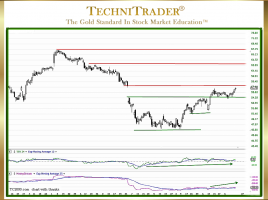
Identify Momentum & Velocity Market Conditions Using Indicators When the Stock Market moves with plenty of momentum and velocity activity, it provides opportunities for Swing Traders to hold a trade through a 1–10 day run up and then exit before the stock encounters profit taking. Below is a stock chart …

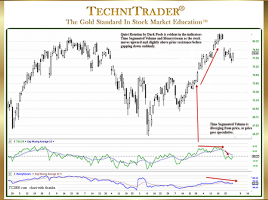
What Indicators Reveal Dark Pool Quiet Rotation™?

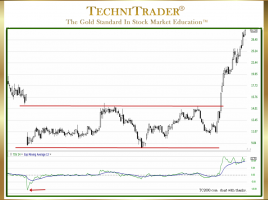
Time Segmented Volume and MoneyStream Reveal Buy Side Institutions Buy Side Institutions use Dark Pools to hide their giant-lot orders and to ensure that there is no major disruption of the current trend when those orders are triggering. The Securities and Exchange Commission (SEC) has investigated the practices of Buy …

What Is the Best Way for Trading Options?

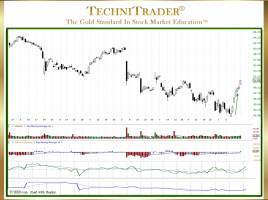
Use Stock Chart Analysis Options Trading requires that you know more than just options chains, puts and calls, and other basics. Options Trading for beginners is often confusing and overwhelming and can result in a significant loss of your capital base unless you learn right from the get-go that trading …

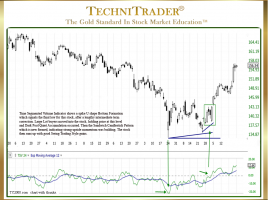
Why Does Time Segmented Volume Indicator Lead Price?

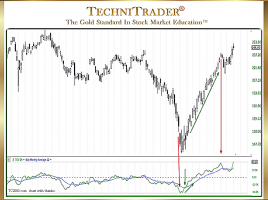
Has a Unique Cumulative Formula Rather Than Average-Based Time Segmented Volume (TSV) is a rare stock Volume Oscillator which provides leading indicator signals that are invaluable to short-term trading of stocks. Applicable styles of trading include Swing Trading, Momentum Trading, Position Trading, and Day Trading. As the Market Structure has …