Currently browsing tag

volume

What Is the Power in Platform Candlestick Patterns?

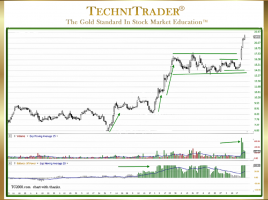
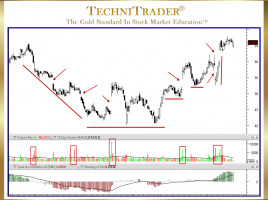
Buy Side Institutions Buying in Dark Pools Prior to Runs The “Platform Candlestick Pattern” is a relatively new sideways candlestick pattern that is becoming more and more prevalent as the Dark Pools’ activity increases. Dark Pools are Alternative Trading System (ATS) venues that transact giant-lot orders off of the Exchanges. …

How to Find the Giant Buy Side Institutions

Identify Platform Candlestick Patterns for Low Risk & Early Entry The giant Buy Side Institutions control vast amounts of money on behalf of their fundholders. They are the giant Mutual Funds and Pension Funds in the US and around the world. Most of the time, Individual Investors and Retail Traders …

What Are 5 Tips for Sell Short Success?

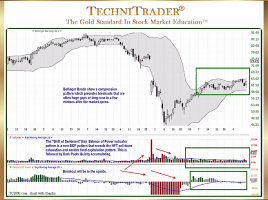
New Topping Candlestick Patterns List and New Entries & Exits Selling Short is a Trading Style few Retail Traders and Technical Traders use even during major Bear Markets. The reason is because it is often far more challenging to understand the technical patterns of the downtrend which include 5 Tips …

Why Use Stock Volume and Quantity Analysis?

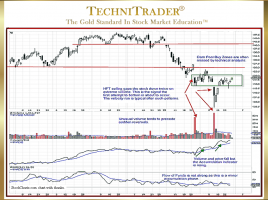
To Identify Price Action by Stock Market Participant Groups Before there were High Frequency Traders (HFTs), Dark Pools, Twilight Pools, and an 80% automated marketplace, the most important indicator was price. Many Retail Traders learned to simply rely upon price action and rarely considered stock volume or quantity analysis. Chart …

How to Choose Stock Indicators

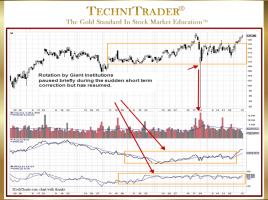
7 Tips for Selecting Best Indicators for the Stock Market Today Stock Indicators are one of the most useful tools for Individual Investors and Retail Traders. However, choosing the right indicators for your Trading Style and Strategies can be a daunting task. There are over 250 indicators available in the …

Why Is the Weekly Chart View Invaluable?

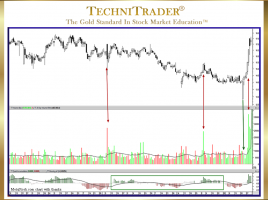
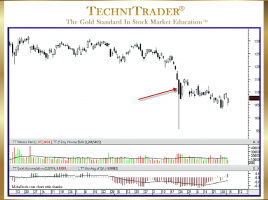
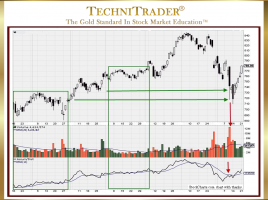
For Interpreting What Price Will Do After Stock Volume Spikes The chart example below with a Daily Chart View shows that High Frequency Traders (HFTs) caused a huge white candlestick and stock Volume spike, as indicated by the vertical red line on the right. Since then, this stock has been …

How to Trade Stocks Profitably for Beginners

Precise Sideways Price Action Means Buyers Are Dominant Most Individual Investors and Retail Traders do not realize that they have a huge advantage over the professional side of the market. This is due to the constraints, restrictions, rules, and regulations the professional side must comply with on an ongoing basis. …

How to Interpret Extreme Candlestick Patterns

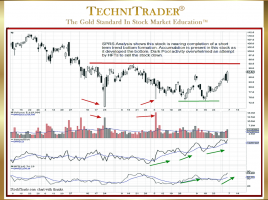
Identify Dark Pool Buy Zones™ in Stock Bottom Formations Every Technical Trader and Retail Trader knows that Bottom Formations are often completed with a Momentum or Velocity Run, but few are able to capture those big gains because they are unable to recognize the candlestick patterns that precede the run. …

6 pages