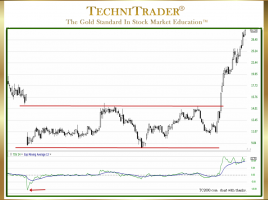
What Are 5 Tips for Sell Short Success?

New Topping Candlestick Patterns List and New Entries & Exits Selling Short is a Trading Style few Retail Traders and Technical Traders use even during major Bear Markets. The reason is because it is often far more challenging to understand the technical patterns of the downtrend which include 5 Tips …

Why Use Stock Volume and Quantity Analysis?

To Identify Price Action by Stock Market Participant Groups Before there were High Frequency Traders (HFTs), Dark Pools, Twilight Pools, and an 80% automated marketplace, the most important indicator was price. Many Retail Traders learned to simply rely upon price action and rarely considered stock volume or quantity analysis. Chart …

Day Trading vs. Position Trading Stocks Comparison

Differences in Styles, Costs, and Profits Day Trading is the most widely talked about Trading Style for Retail Traders. However, it is the least profitable of all the short-term Trading Styles. This is a little-known fact that no one ever tells Retail Traders when they start to learn to trade …

How to Choose Stock Indicators

7 Tips for Selecting Best Indicators for the Stock Market Today Stock Indicators are one of the most useful tools for Individual Investors and Retail Traders. However, choosing the right indicators for your Trading Style and Strategies can be a daunting task. There are over 250 indicators available in the …

How to Find Swing Trading Style Runs

Identify Momentum & Velocity Market Conditions Using Indicators When the Stock Market moves with plenty of momentum and velocity activity, it provides opportunities for Swing Traders to hold a trade through a 1–10 day run up and then exit before the stock encounters profit taking. Below is a stock chart …

Why Is the Weekly Chart View Invaluable?

For Interpreting What Price Will Do After Stock Volume Spikes The chart example below with a Daily Chart View shows that High Frequency Traders (HFTs) caused a huge white candlestick and stock Volume spike, as indicated by the vertical red line on the right. Since then, this stock has been …

How to Analyze Stock Support and Resistance

Comparing Price Action with Leading Indicators During a downtrend, traders need to be able to determine if a big white candlestick is a true Reversal back to an uptrending pattern or if it is just momentary Rebound price action caused by Buy the Dip Investors and Buy to Cover Traders. …

19 pages