
What Is the Stock Market Participant Groups Cycle?
Candlestick Patterns Show Which Group Is in Control of Price
The Stock Market Participant Groups Cycle occurs in visual candlestick patterns on the charts, and analysis should be confirmed with appropriate indicators. The following is a breakdown of how Stock Market Participant Groups move price in specific ways with the group’s name in the cycle. The Index chart example below shows their footprints.
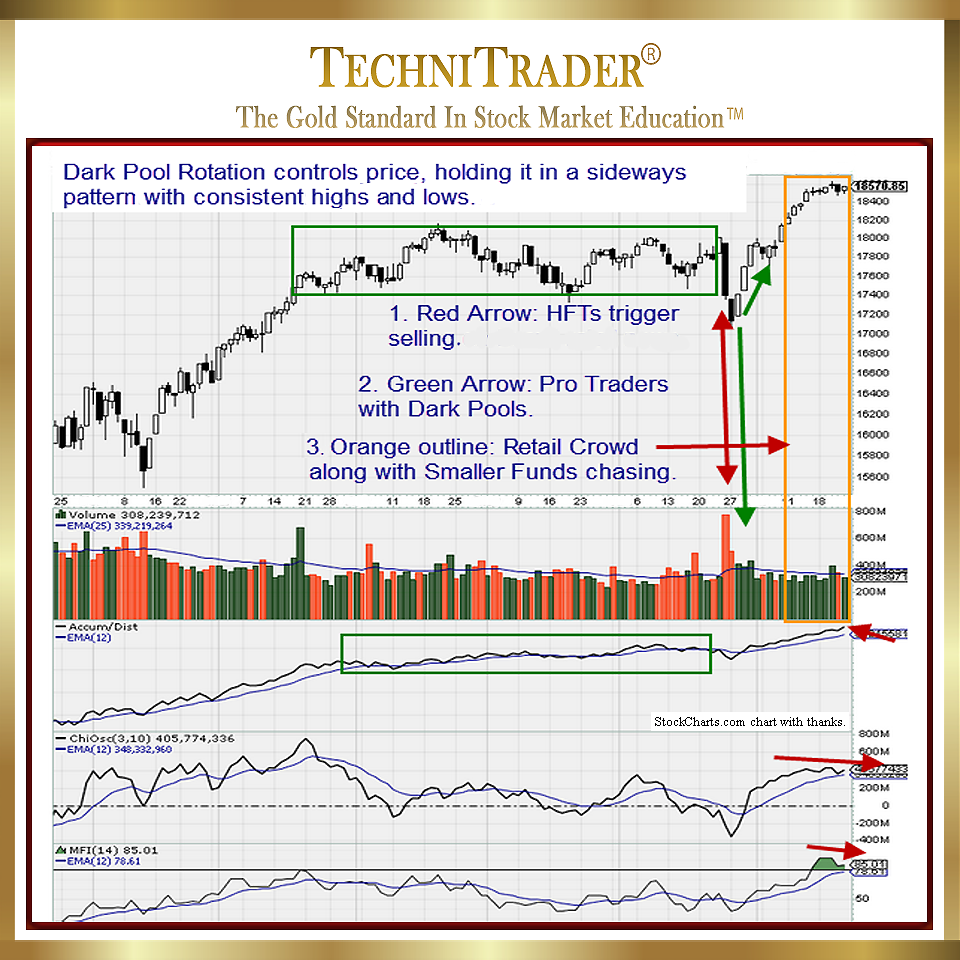
Prior to this short-term bottom, the Index had been in a weak Trading Range wide sideways candlestick pattern after a “fake rally” brought about by the Retail Traders Stock Market Participant Group and the Smaller Funds Stock Market Participant Group. The rally failed to break through the resistance highs, which was a critical factor in the analysis of this Index at that time. Coupled with lower stock Volume, inconsistent runs, and a lack of Dark Pool Quiet Accumulation continuation patterns, the fake rally collapse was obvious even before the steady lower highs.
The collapse of the fake rally caused many Smaller Funds to panic and start selling, as their portfolios could not manage the selling spree initiated by the High Frequency Traders (HFTs) Stock Market Participant Group. This fueled the selling with of course retail news spurring smaller investors to fear and panic as well.
Stocks plummeted to the prior low Dark Pool Buy Zone™ around 15,500. The Dark Pools of the Buy Side Institutions Stock Market Participant Group had Time Weighted Average Price (TWAP) orders that were waiting to trigger large lots of 100,000–400,000 and giant lots which are over 500,000 to buy specific index components at bargain prices for Fundamentalists.
There are many large to giant-lot orders still moving through the automated market system, but you just cannot see them anymore as they are ALL off the exchanges.
The Buy Zone for the Dark Pools was fairly wide and halted the selling panic quickly.
A true rally followed with Buy Side Institutions using Dark Pools raising their Buy Zone’s range. This was instigated as Fundamentals slowly caught up to stock prices. The Index moved up to the prior resistance level and halted as the Buy Side Institutions ceased buying well below that level, which is their normal pattern.
LEARN MORE at TechniTrader.Courses
Trade Wisely,
Martha Stokes CMT
TechniTrader technical analysis using a StockCharts chart, courtesy of StockCharts.com
Chartered Market Technician
Instructor & Developer of TechniTrader Stock & Option Courses
Copyright ©2017–2024 Decisions Unlimited, Inc. dba TechniTrader. All rights reserved.
TechniTrader is also a registered trademark of Decisions Unlimited, Inc.