Why Analyze Price, Stock Volume, & Accum/Dist Indicator Combined?
Identify Stock Market Participant Groups by Price & Indicator Patterns
The StockCharts.com indicator Accum/Dist was designed to help track the large-lot versus small-lot activity. Decades ago, when the concept of distinguishing between the large lots versus the small lots started being discussed by the Sell Side Institutions, the Stock Market was an entirely different Market Structure. Almost all orders back then were filled on the exchanges via Market Makers.
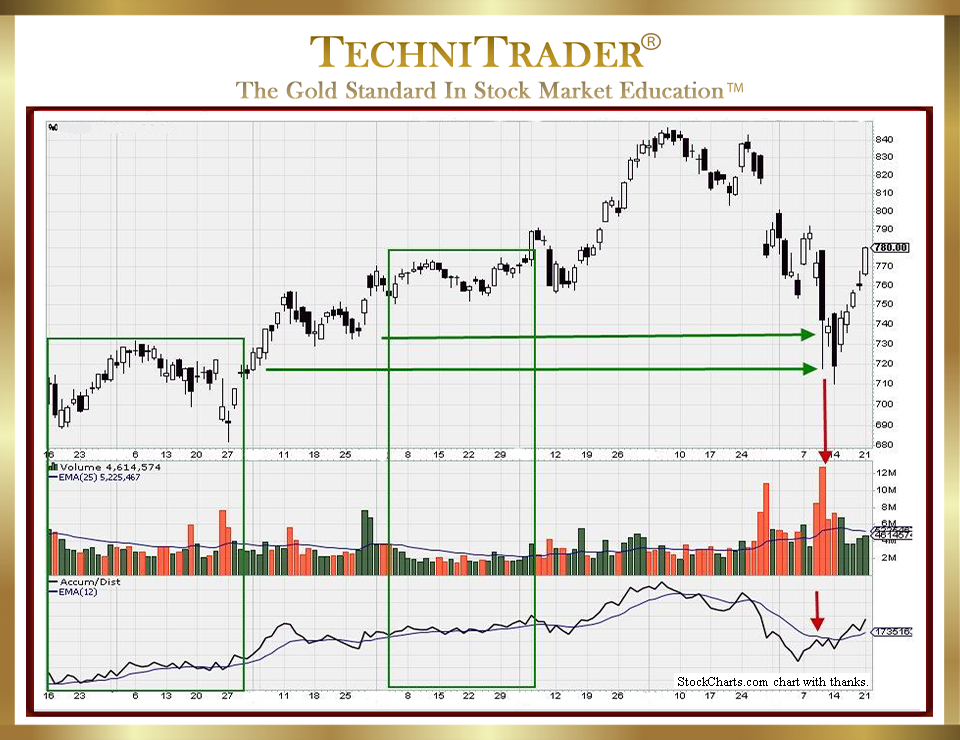
See the stock chart example below.

There were Mutual Funds but no Pension Funds in the Stock Market. In addition, the number of Stock Market Participant Groups was 5, not the 9 there are today in the Stock Market, so interpretation of this indicator was simpler. Now, each of the 9 Stock Market Participant Groups have different stock order types, venues, order sizes, agendas, and a vast disparity of information available to them. By the time the retail crowd gets the news, it is old news to just about every other Stock Market Participant Group.
When analyzing a stock using the Accum/Dist indicator, you MUST use Relational Technical Analysis™ because it is more complete. This type of analysis combines the Stock Price via Candlestick Patterns and Trend and Trendline Patterns, as well as the stock Volume and Accum/Dist indicators.
If you want to use Accumulation Indicators, you need to approach their use properly for the current Stock Market of today. The footprint of each different Stock Market Participant Group is in the combination of these on the chart and can be found in Price, stock Volume, and the StockCharts.com Accum/Dist indicator.
Price shows the magnitude of the daily Price action. For example, was Price contained and controlled via Time Weighted Average Price (TWAP) orders, or were High Frequency Traders (HFTs) creating huge candlestick Price action? Each group has its own candlestick amplitude that it creates, which is often deliberately based on the stock buy ORDER TYPE they prefer to use and the VENUE they typically use.
The Trend and Trendline Patterns tell you who is trading OR investing in the stock. Dark Pools are not found in stocks that are topping; rather, they are found in Bottoming Candlestick Patterns in the Dark Pool Buy Zones™.
LEARN MORE at TechniTrader.com
Trade Wisely,
Martha Stokes CMT
TechniTrader technical analysis using a StockCharts chart, courtesy of StockCharts.com
Chartered Market Technician
Instructor & Developer of TechniTrader Stock & Option Courses
Copyright ©2017–2026 Decisions Unlimited, Inc. dba TechniTrader. All rights reserved.
TechniTrader is also a registered trademark of Decisions Unlimited, Inc.
