
Candlestick Patterns: 10 Things You Need to Know
Whether you are a long-term investor or day trader, using Candlestick Charts will help you achieve higher returns than any other type of stock chart. What deters many new investors and beginning stock traders is the confusing terminology of the traditional Candlestick Charting that came originally from Japan. In addition, many experienced traders struggle with candlesticks because they are unaware of the differences of the patterns that form in our modern automated marketplace. These patterns differ from the original Japanese Candlestick Patterns in many ways.
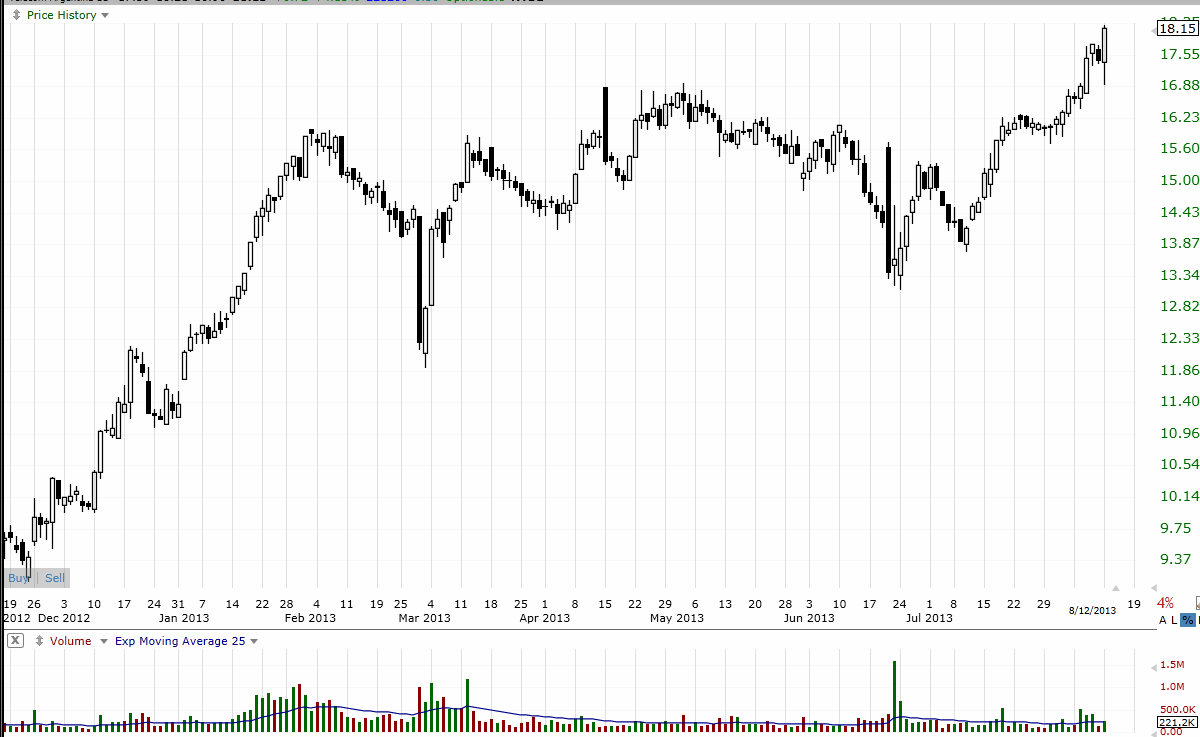
Looking at the chart below, can you identify every Candlestick Pattern that you see? Are there many patterns that seem to make no sense or that you haven’t learned? Does the price action seem to be more random? Do the candles behave as you have been taught?
Here’s why:
- The Stock market of today is dominated by the institutions. Their buying patterns reflect the automation of their orders. That means the patterns are quite different than in an open-cry market, or a market where a human enters the order.
- Spreads: The difference between the Bid and the Ask has shrunk to a penny on the retail side, and often a partial penny on the professional side. With tighter spreads, Candlestick Patterns are altered greatly.
- High Frequency Trading creates huge candlesticks that never formed in the Japanese marketplace of the 1600s when candlesticks were first developed.
- The orders that the giant funds use control price to often keep it forming many Doji, which is another pattern rarely, if ever, seen in the Japanese version of candlesticks.
- Many Candlestick Patterns form in our automated market that are not identified in the traditional candlestick books. Examples: Sandwich, Springboard, Push, and Resting.
- In Western markets, groups of candles should be studied using far more than the traditional 3 used in Japanese candlesticks.
- Dark Pool orders hold price at specific price levels creating a new sideways pattern called a Platform, which is wider than a Consolidation but narrower than a Trading Range.
- Traditional candlesticks were not used with Volume; however, not using Volume in conjunction with today’s Candlestick Patterns increases risk of whipsaw trades and poor fills.
- Stocks can and do run much further with longer candles and more candles in a run than in traditional Candlestick Patterns. Not understanding the speculative momentum action of the automated market and why stocks run further can lower your profits significantly.
- Candlestick Patterns play a key role in determining where stocks will stall, reverse, or move with momentum. Resistance and Support formations are critical to using candlesticks for optimal stock pick selection as well as entries and exits. Knowing what support to use for trailing profit stops will make a huge difference in your monthly income.
I invite you to visit my website at www.TechniTrader.Courses
Trade Wisely,
Martha Stokes CMT
Chartered Market Technician
Instructor & Developer of TechniTrader Stock & Option Courses
Copyright ©2017–2024 Decisions Unlimited, Inc. dba TechniTrader. All rights reserved.
TechniTrader is also a registered trademark of Decisions Unlimited, Inc.
Disclaimer: All statements, whether expressed verbally or in writing are the opinions of TechniTrader its instructors and or employees, and are not to be construed as anything more than an opinion. Readers are responsible for making their own choices and decisions regarding all purchases or sales of stocks or issues. TechniTrader is not a broker or an investment advisor; it is strictly an educational service.