
How to Interpret Extreme Candlestick Patterns
Identify Dark Pool Buy Zones™ in Stock Bottom Formations
Every Technical Trader and Retail Trader knows that Bottom Formations are often completed with a Momentum or Velocity Run, but few are able to capture those big gains because they are unable to recognize the candlestick patterns that precede the run. Instead, most Technical Traders chase the run and either net a mediocre profit or have a small loss instead of the big gains they wanted.
See the chart example below, in a daily view.
It is a simple matter of knowing what to look for during a Correction that indicates BEFORE the momentum of a Short-Term Bottom or Rebound that the stock has hit a Dark Pool Buy Zone and will start a bottom shortly thereafter. Relational Technical Analysis™ is what I call this early kind of candlestick pattern identification.
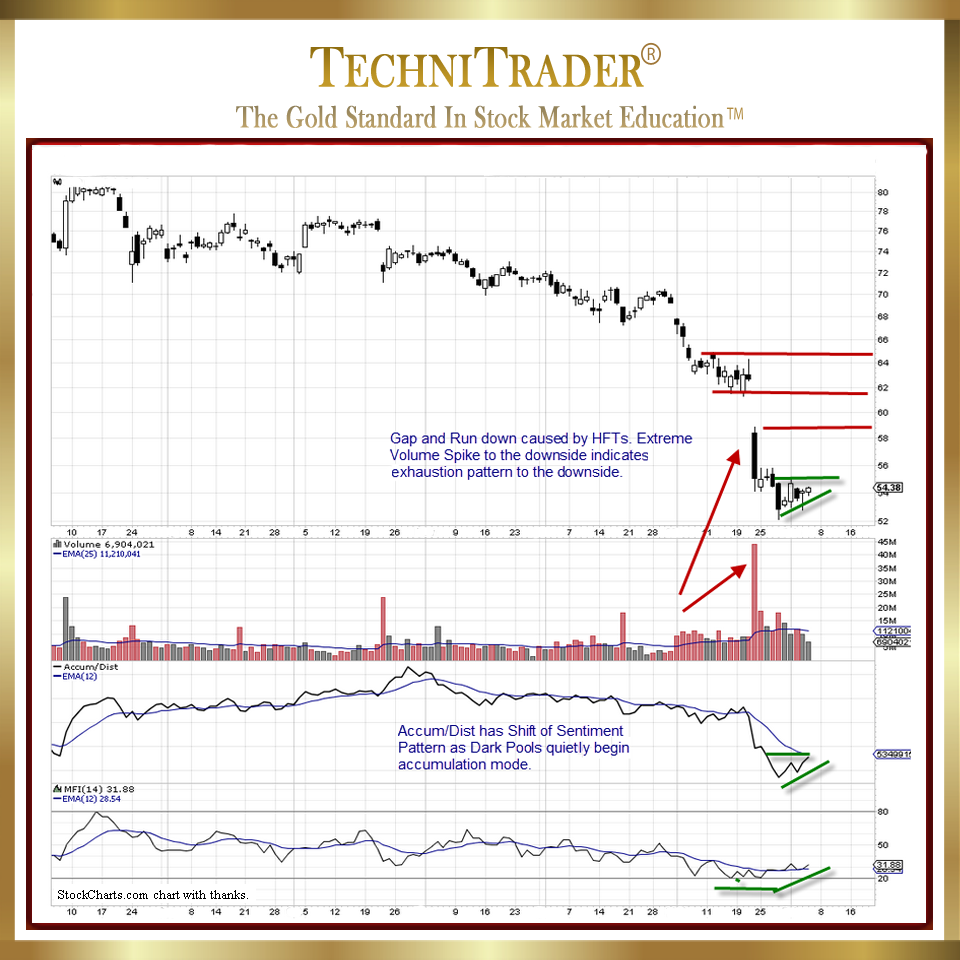
When interpreting extreme candlestick patterns using Relational Technical Analysis, the following is the order in which to proceed with the chart analysis in order to identify a Dark Pool Buy Zone:
1. Look at Price first.
In this chart example after a huge gap and run down, price has shifted to an ever-tightening Compression Pattern. Compression Patterns tend to form before a sudden breakout, aka Momentum or Velocity Run.
LEARN MORE at TechniTrader.Courses
Trade Wisely,
Martha Stokes CMT
TechniTrader technical analysis using StockCharts charts, courtesy of StockCharts.com
Chartered Market Technician
Instructor & Developer of TechniTrader Stock & Option Courses
Copyright ©2017–2024 Decisions Unlimited, Inc. dba TechniTrader. All rights reserved.
TechniTrader is also a registered trademark of Decisions Unlimited, Inc.