
How to Interpret TC2000 Balance of Power Stock Indicator
Use Technical Analysis Including Price & Stock Volume
To know how to interpret the Balance of Power (BOP) Stock Indicator with accuracy and reliability, you must study Price, stock Volume Patterns, AND Balance of Power. It dramatically shortens the time it takes to select stocks for trading the next day. See the stock chart example below with candlestick Price, stock Volume in the middle chart window, and Balance of Power in the bottom chart window. The deciphering of Balance of Power comes from the relationship between Price, stock Volume, and the indicator itself, as well as understanding the 9 different Stock Market Participant Groups along with how each of them affects Price, stock Volume, and the indicator.
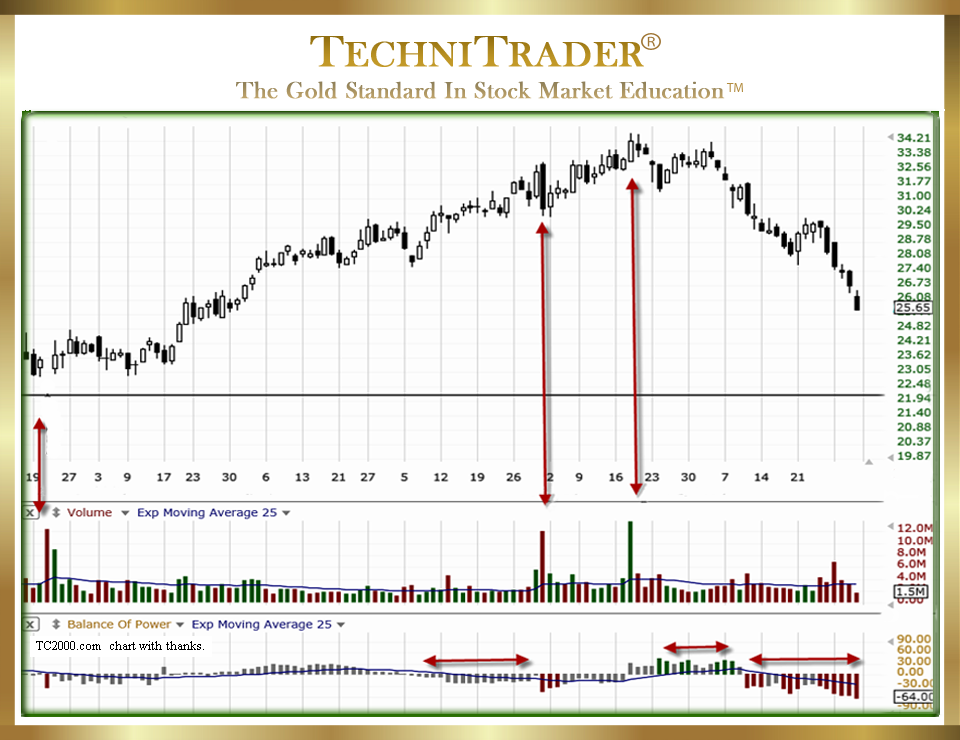
As an example of how to interpret the Balance of Power Stock Indicator, the 3 double arrows all point to High Frequency Trader (HFT) activity on a one-day surge Balance of Power pattern. High Frequency Traders follow the lead of the Buy Side Institutions, who with considerable talent exit a stock as it is moving up driven by Small Lots buying emotionally.
LEARN MORE at TechniTrader.Courses
Trade Wisely,
Martha Stokes CMT
TechniTrader technical analysis using a TC2000 chart, courtesy of Worden Bros.
Chartered Market Technician
Instructor & Developer of TechniTrader Stock & Option Courses
Copyright ©2017–2024 Decisions Unlimited, Inc. dba TechniTrader. All rights reserved.
TechniTrader is also a registered trademark of Decisions Unlimited, Inc.