
Why Are Quantity Indicators Most Important?
They Reveal Dark Pool Quiet Accumulation
Momentum Runs are not perpetual. At some point, Professional Technical Traders, who are one of several drivers behind Momentum Runs, will take profits at technical resistance levels. The chart example below is an excellent example of why so many Swing Traders using Stop and Reverse Strategies (SARS) which focus solely on Price action have problems and whipsaw trades that go against them.
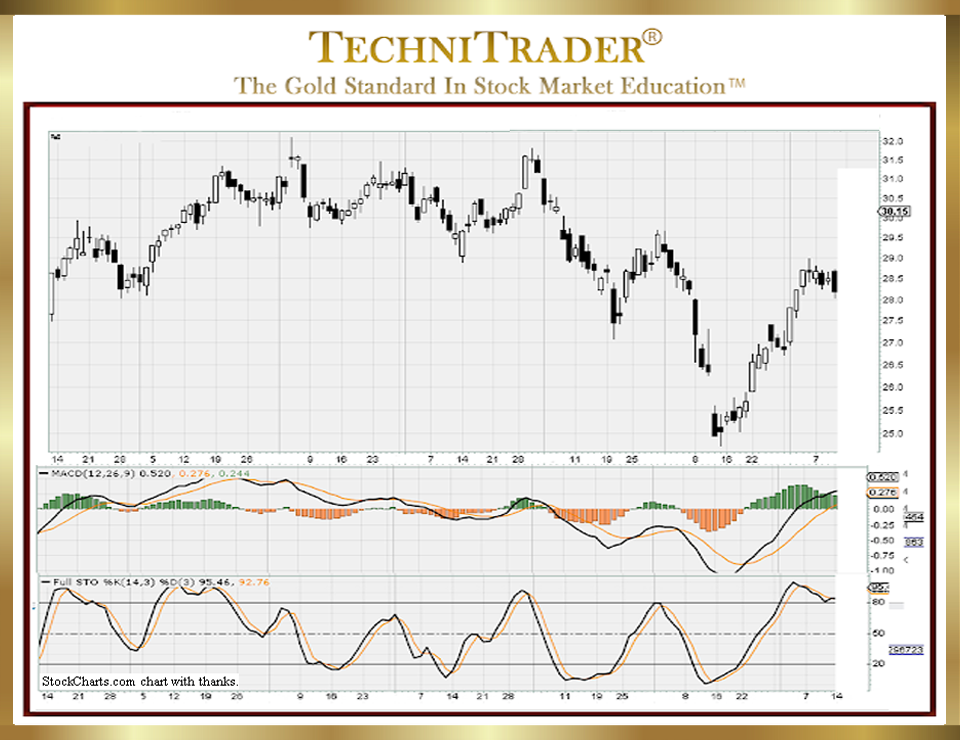
See stock chart example #1 below.
Understanding whether the Price action is simply profit taking by Professional Traders or a sudden reversal of trend is critical to successful Swing Trading. Oftentimes, Retail Swing Traders make the mistake of using a “Stop and Reverse Strategy” with disastrous results during a Momentum Market Condition.
The key analytical elements rest with the Relational Technical Analysis™ between what Price does during profit taking and how stock Volume and Quantity Indicators are behaving. Are the stock Volume and Quantity Indicators confirming, or are they contrarian to the Price action?
The chart shows a Momentum-Style Run out of a “Basing Bottom”. This formation is one of many new bottoming types that have started showing up over the past couple of years. It is because the Dark Pool venues have increased activity off the exchanges with new stock order types that allow for new controls on entries for giant-lot activity by the giant institutions.
The majority of indicators that are popular now are Price and Time Indicators. Just using them for direction indication on the last day shown on the chart, it really looks like the stock is poised for far more than just profit taking. It appears that the Engulfing Black Candlestick is a Sell Signal or Sell Short Signal. The expectation of Technical Traders who only use Price and Time Indicators would be that this stock is going down.
LEARN MORE at TechniTrader.Courses
Trade Wisely,
Martha Stokes CMT
TechniTrader technical analysis using StockCharts charts, courtesy of StockCharts.com
Chartered Market Technician
Instructor & Developer of TechniTrader Stock & Option Courses
Copyright ©2017–2024 Decisions Unlimited, Inc. dba TechniTrader. All rights reserved.
TechniTrader is also a registered trademark of Decisions Unlimited, Inc.