Why Analyze Sideways Bottoming Stock Trends?
To Identify Dark Pool Buy Zones™
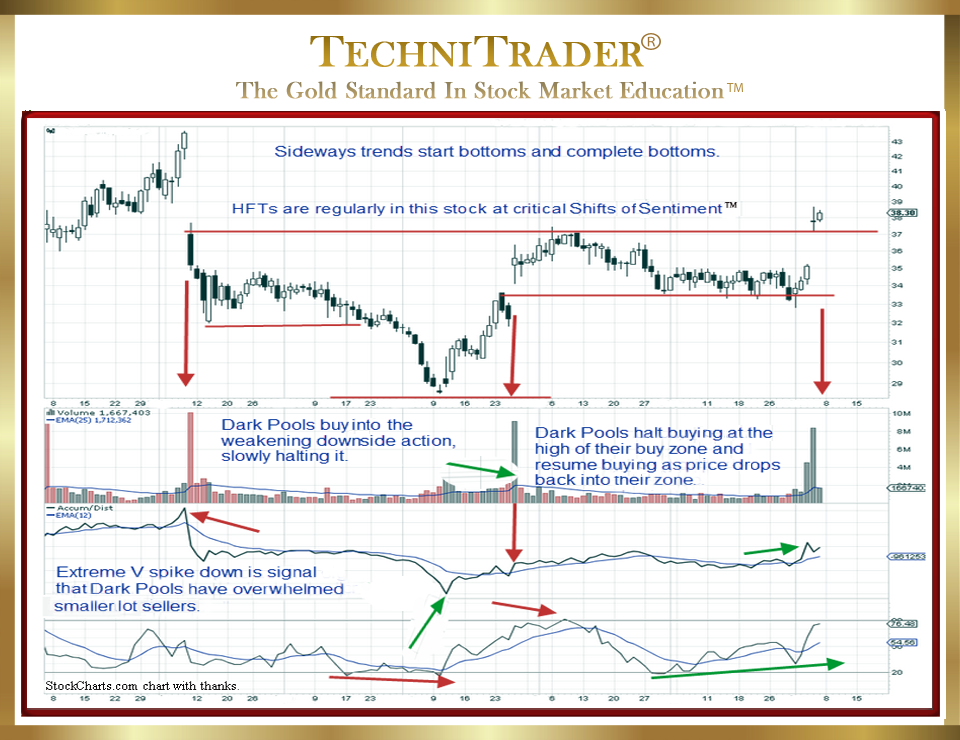
The Shift of Sentiment™ pattern in the stock chart example below clearly and easily shows that Buy Side Institutions using Dark Pools entered this stock and would quickly take control of price. Sideways bottoming stock trend analysis of the chart shows that a sudden reversal occurred when they moved in quietly, even while the price action continued downward for a brief period after the Shift of Sentiment. Buy Side Institutions using Dark Pools prefer to buy into a bottoming weakness when sellers are running out of capital to trade. See the stock chart example below.

High Frequency Traders (HFTs) were also present in this stock prior to and during the entire bottoming phase. Sideways bottoming stock trend analysis easily shows their entry with the gap down and a huge stock volume spike, as indicated by the first red arrow on price to the left.
Their presence is also shown by the huge stock volume spikes, as indicated also by red arrows on price. These High Frequency Traders were using 3 different kinds of their most popular strategies.
Sideways bottoming stock trend analysis reveals that although the Platform Candlestick Pattern developed after the stock price moved beyond the Dark Pool Buy Zone, it only slipped to fill the prior gap before halting firmly within the lows of the Buy Zone established at that higher level.
LEARN MORE at TechniTrader.Courses
Trade Wisely,
Martha Stokes CMT
TechniTrader technical analysis using a StockCharts chart, courtesy of StockCharts.com
Chartered Market Technician
Instructor & Developer of TechniTrader Stock & Option Courses
Copyright ©2015–2025 Decisions Unlimited, Inc. dba TechniTrader. All rights reserved.
TechniTrader is also a registered trademark of Decisions Unlimited, Inc.
