
Why Use Stock Volume to Reveal Weak Candlestick Patterns?
How Retail Traders Avoid Whipsaw Trades
Many traders still rely solely upon Price and Price Indicators, which leaves them highly vulnerable to whipsaw trades. Stock Volume reveals weak candlestick patterns, and so it is critical to use it in the automated markets today. This is because the giant Buy Side Institutions using Dark Pool Alternative Trading Systems (ATSs) place 80% of all orders in the Stock Market, which are processed automatically via a computer program set to fill large orders over time without moving price.
The series of four charts within this article are the same stock over a period of time, and they will provide examples of how stock Volume reveals weak candlestick patterns. In candlestick chart example #1 below, the first blue arrow on the left shows a common gap up to a long white candlestick. It has an extraordinarily long stock Volume bar in the middle chart window which is the footprint of High Frequency Trader (HFT) orders.
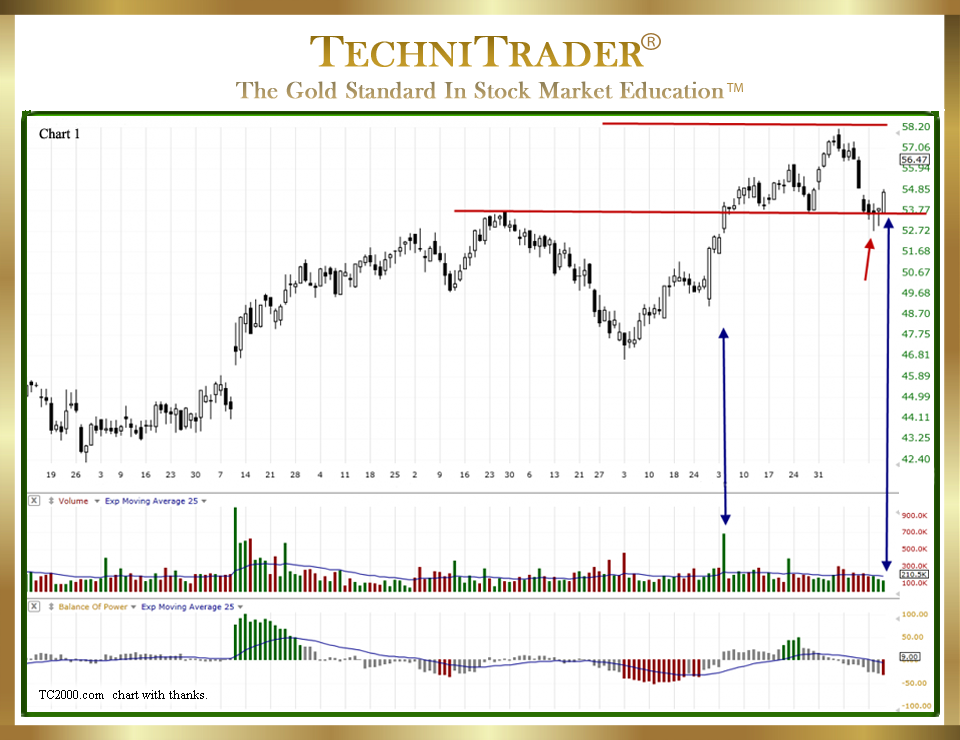
The stock did not move up strongly after that HFT action because stock Volume was weaker near or below its moving average line after the one-day stock Volume spike.
The second blue arrow points to the last candlestick, which is an Engulfing White. However, see that stock Volume is dropping well below the stock Volume Indicator’s Moving Average.
This is a warning that this stock lacks sufficient buyers. In addition, the Balance of Power (BOP) indicator in the bottom chart window is showing a red bar as price action moves up. This is a divergence pattern indicating that a giant Buy Side Institution is rotating slowly and carefully out of this stock without affecting price.
Often, Engulfing White Candlesticks (aka Bullish Candlestick Patterns) are commonly used for entries, but because stock Volume reveals weak candlestick patterns, this example shows that it is not a buy signal by itself. Look at price action for the two days prior to that candlestick forming and see that the stock had two reversal candlesticks, as indicated by the short red arrow, where sellers attempted to sell the stock down. However, buyers moved in triggered by the support from the highs indicated by the lower red line, which is a technical bounce area for this stock. A giant Buy Side Institution is selling while smaller lots are buying, and this weighs the Balance of Power indicator to the downside. The Engulfing White represents about a 1-point gain, which is minuscule given the Risk/Reward Ratio and the price of this stock.
In candlestick chart example #2 below, the following day the stock forms an indecision day candlestick rising slightly above the previous high and settling back to the close with much lower stock Volume.
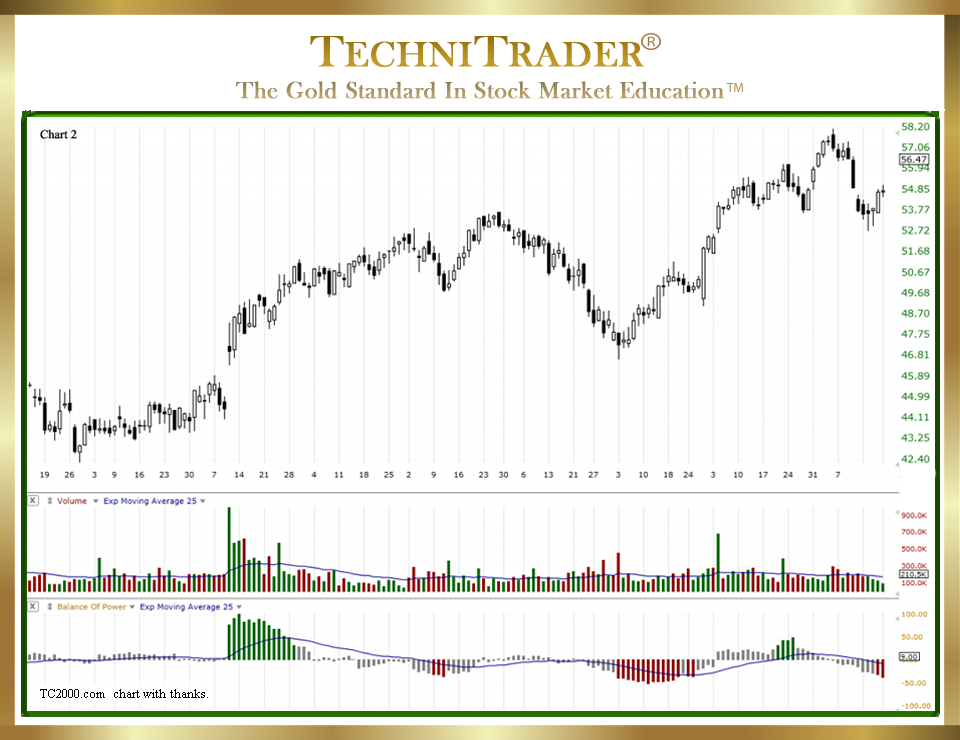
In candlestick chart example #3, the next day the stock moves up about 1 point, again on rising stock Volume but with more Dark Pool Quiet Rotation™ shown by the red bars in the Balance of Power indicator. The stock moves up to the weak resistance level as shown by the middle red line, but it pulls back before the close of the day as indicated by the wick on the candlestick. Remember that stock Volume reveals weak candlestick patterns, and see that stock Volume is still below its moving average.
LEARN MORE at TechniTrader.Courses
Trade Wisely,
Martha Stokes CMT
TechniTrader technical analysis using TC2000 charts, courtesy of Worden Bros.
Chartered Market Technician
Instructor & Developer of TechniTrader Stock & Option Courses
Copyright ©2017–2025 Decisions Unlimited, Inc. dba TechniTrader. All rights reserved.
TechniTrader is also a registered trademark of Decisions Unlimited, Inc.