Which Stock Indicators Drive Profits?
Quantity Defines Many Aspects of the Trade
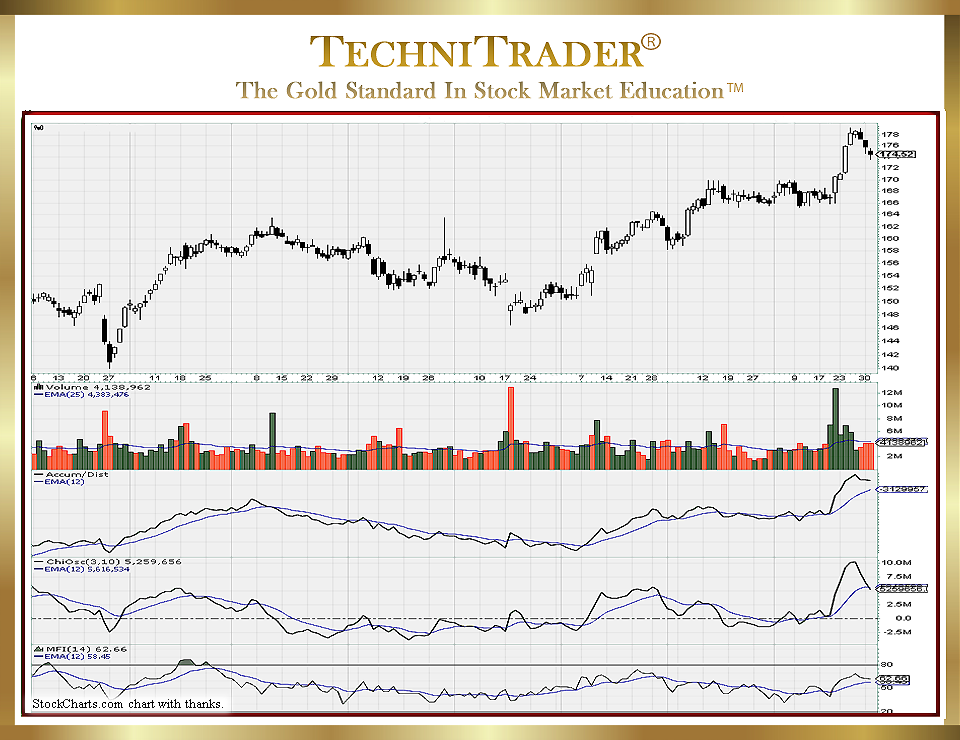
There are massive internal and hidden Market Structure changes going on. Using ALL of the Data available from the markets is imperative for reliable and highly profitable trades. There is often confusion regarding the least-used Data Set for stock indicators, which is QUANTITY.

Here is a list of what Quantity reveals in Candlestick Chart Analysis:
- Who controls price. There are now 10 Stock Market Participant Groups who at any time can seize control of price and dominate price direction, run potential, and the sustainability of the run.
- How they are controlling price. There are numerous stock order types that Retail Traders do not have access to, such as Time Weighted Average Price (TWAP) and all of its variable combinations. There are also many routing systems only available to Professional Traders and Accredited Retail Investors using professional platforms.
- On which side of the trade is the dominance? In order to fill a large-lot order, numerous smaller lots are often bundled into the same order. That may not be reflected in price. Oftentimes, smaller lots are buying into heavy large-lot selling as Dark Pool Quiet Rotation™ by Giant Funds is well-hidden. This means the Retail Trader is more likely to experience a whipsaw trade.
- How price behaves with any Stock Market Participant Group dominance. Retail Traders tend to be highly emotional, and stock prices tend to run on lower quantity levels. This exposes a weakness of the run prior to whipsaws or retracements that can wreak havoc on short-term trades.
- Duration of the run. Quantity Data helps reveal whether larger lots are continuing and increasing their buying or selling during the run. This occurs when Professional Traders take control and move price ahead of High Frequency Traders (HFTs) with sufficient stock Volume to trigger the High Frequency Trader algorithm.
It doesn’t matter what Trading Style you use, whether it is Swing, Day, Intraday, Position, or Intermediate-Term. All Trading Styles need to incorporate stock indicators that complete the Data Set for Stock Chart Analysis.
When Technical Analysis was first developed over 50 years ago, price was considered the most important indicator, and rightly so for that era. However, the markets of today are completely different.
LEARN MORE at TechniTrader.Courses
Trade Wisely,
Martha Stokes CMT
TechniTrader technical analysis using a StockCharts chart, courtesy of StockCharts.com
Chartered Market Technician
Instructor & Developer of TechniTrader Stock & Option Courses
Copyright ©2017–2025 Decisions Unlimited, Inc. dba TechniTrader. All rights reserved.
TechniTrader is also a registered trademark of Decisions Unlimited, Inc.
