How to Use Balance of Power Indicator Properly
4 Tips Include Indicator Bar Length & Color
TC2000 Users have a huge advantage over traders who do not use this charting program. Unfortunately, most TC2000 Users are not taking full advantage of the tools embedded in this program. One of the many tools that are unique to TC2000 is the Balance of Power (BOP) indicator. This indicator continues to evolve and change as the Market Structure changes, making it one of the most powerful indicators ever written.
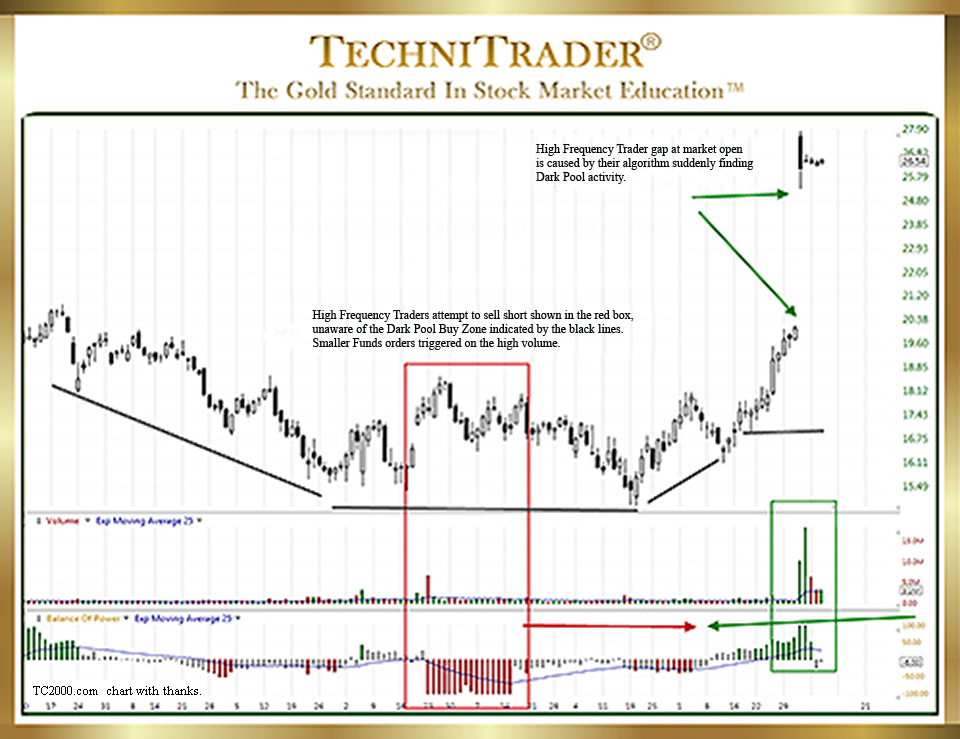
The chart example below shows Relational Technical Analysis™, which gives the Balance of Power indicator a logical and sensible interpretation that traders can use to enter a stock before huge gaps and runs.

The chart example is a rounding Bottom Formation, which is common for Dark Pool Quiet Accumulation. Bottoms of this kind take several months to complete and can have gaps or sudden runs that provide excellent profits for Swing and Day Traders.
The Relational Technical Analysis of Balance of Power, stock Volume bars, and Price Patterns tells us early on what is happening way ahead of the gap due to High Frequency Traders (HFTs) filling the queues pre-market on the day of the gap. The Dark Pools are quietly accumulating, while Smaller Funds who use Volume Weighted Average Price (VWAP) trigger orders are still dumping the stock, unaware that they are selling into a Dark Pool Buy Zone™ price range.
What tells us this is a Dark Pool Buy Zone is that the extremely long red Balance of Power, which is Volume Weighted Average Price orders of Smaller Funds’ selling, does not drive Price down. Instead, Balance of Power bars turn gray and are very short suddenly and intermittently as Dark Pools go head-to-head against the Volume Weighted Average Price orders, buying incrementally over time.
Stock Volume spikes high above the Exponential Moving Average (EMA) only when High Frequency Traders’ orders trigger again attempting to sell the stock down but failing to move it beyond the lows of the Dark Pool Buy Zone. Then, as Smaller Funds’ selling evaporates, the Shift of Sentiment™ forms on Balance of Power, as indicated by the red and green arrows. This is a trader’s signal that a Momentum Run is imminent.
LEARN MORE at TechniTrader.Courses
Trade Wisely,
Martha Stokes CMT
TechniTrader technical analysis using a TC2000 chart, courtesy of Worden Bros.
Chartered Market Technician
Instructor & Developer of TechniTrader Stock & Option Courses
Copyright ©2017–2025 Decisions Unlimited, Inc. dba TechniTrader. All rights reserved.
TechniTrader is also a registered trademark of Decisions Unlimited, Inc.
