Where Is Support and Resistance for Position Trading?
Compression Candlestick Patterns Caused by Technical & Fundamental Traders
Position Trading support and resistance are caused by the effect of Technical and Fundamental Traders in the stock. A “compression” pattern is a new candlestick pattern where a group of candlesticks indicate that the stock is poised for a sudden move, often a breakaway gap. The compression pattern is one of the most reliable and lowest-risk entries for the automated market and is ideal for Position Trading.
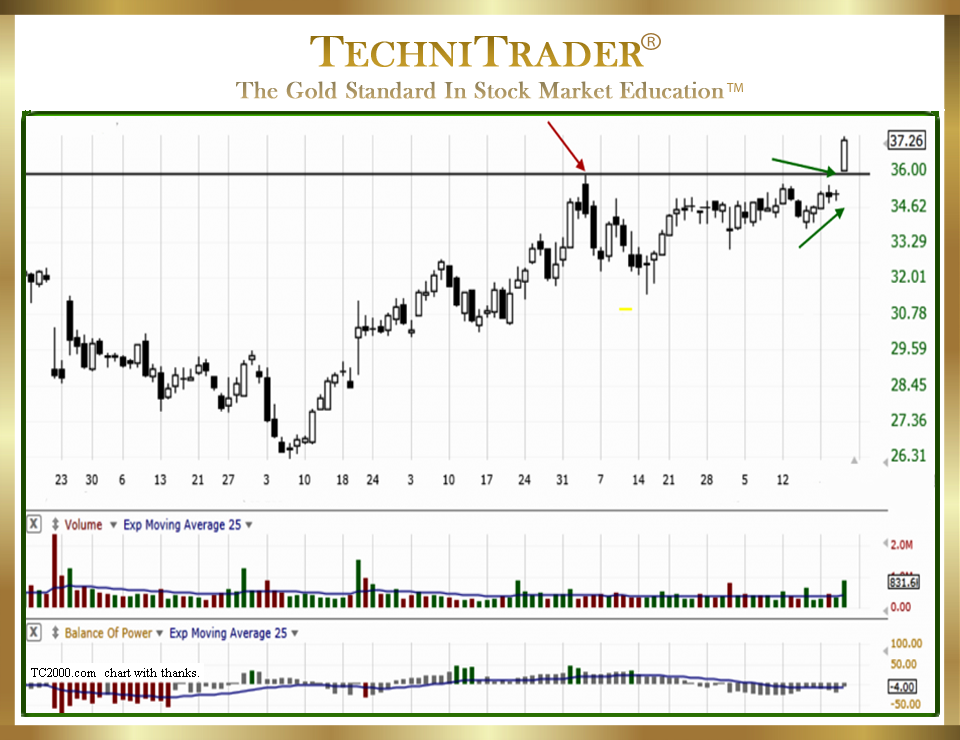
The candlestick chart example below with a Daily Chart View shows a compression pattern with the entry before the breakaway gap.

See that the stock gapped just above the highest high of the sideways candlestick pattern. As the Position Trade is held, it is imperative to study the stock chart support and resistance levels to determine where it will stall, the risk of a retracement, and where it may encounter heavy profit taking.
Two factors affect Position Trading support and resistance levels:
- Technical Traders
- Fundamental Traders
Both have distinctly different areas where they buy or sell. The strength of support or resistance is relevant to these two very different types of Professional Traders. Technical Traders are using pure technical chart patterns, often foolishly assuming they can predict a stock action rather than learning to anticipate price action, and there is a huge difference.
On the other hand, Fundamental Traders are using pure company analytics as they project the company profits and stock value correlations. They are thinking very differently than Technical Traders.
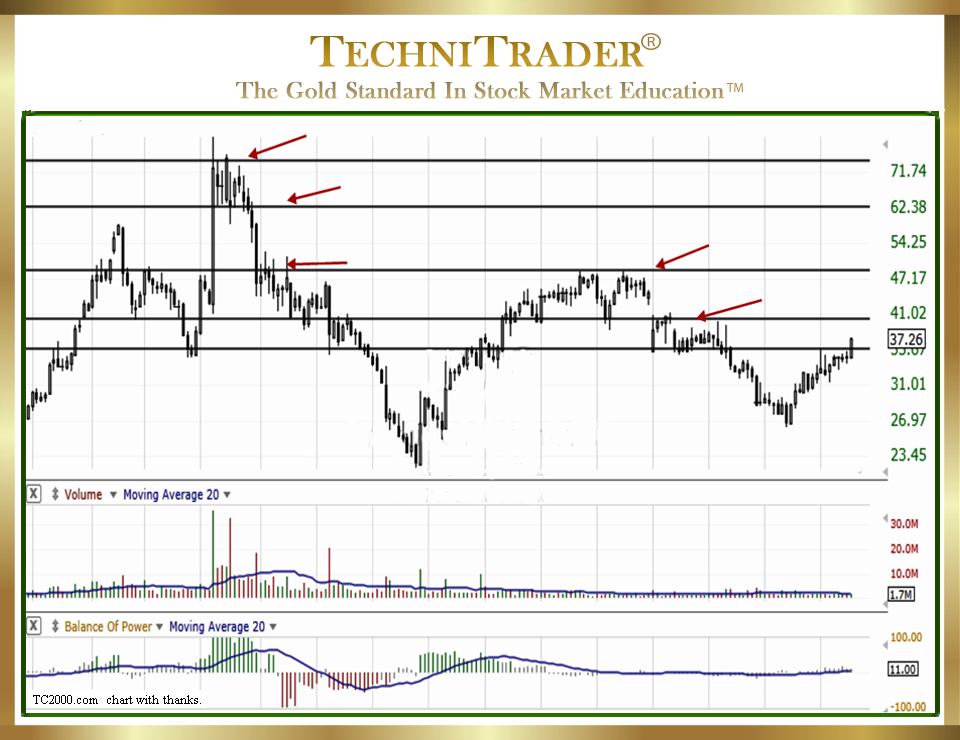
Below is the same candlestick chart example, but with a Weekly Chart View and lines drawn to show the primary resistance levels.

The bottom line drawn on price shows the resistance that was recently broken through, and this must be confirmed with another tight sideways candlestick pattern. If the stock doesn’t move sideways and provide stable horizontal support, then it will retrace or correct as short-term profit-taking Technical Traders react to the price patterns.
LEARN MORE at TechniTrader.Courses
Trade Wisely,
Martha Stokes CMT
TechniTrader technical analysis using TC2000 charts, courtesy of Worden Bros.
Chartered Market Technician
Instructor & Developer of TechniTrader Stock & Option Courses
Copyright ©2017–2025 Decisions Unlimited, Inc. dba TechniTrader. All rights reserved.
TechniTrader is also a registered trademark of Decisions Unlimited, Inc.
