How to Interpret Time Segmented Volume Indicator for Entries and Exits
Contrarian Patterns Lead Price for Higher Profits
The TC2000 Leading Indicator “Time Segmented Volume” (TSV) is unique in its formulation as a stock Volume Oscillator. Although there are a couple of other stock Volume Oscillators in the TC2000 Indicator list, Time Segmented Volume is far superior due to the unusual inclusion of Price as well as stock Volume in the formula. With all 3 pieces of market data in the formula and using a Subordinate Indicator, Technical Traders can see contrarian patterns that lead price sufficiently for earlier entries which result in higher profits for Swing and Momentum Trading. This is particularly beneficial during Bottoming and Topping Market Conditions.
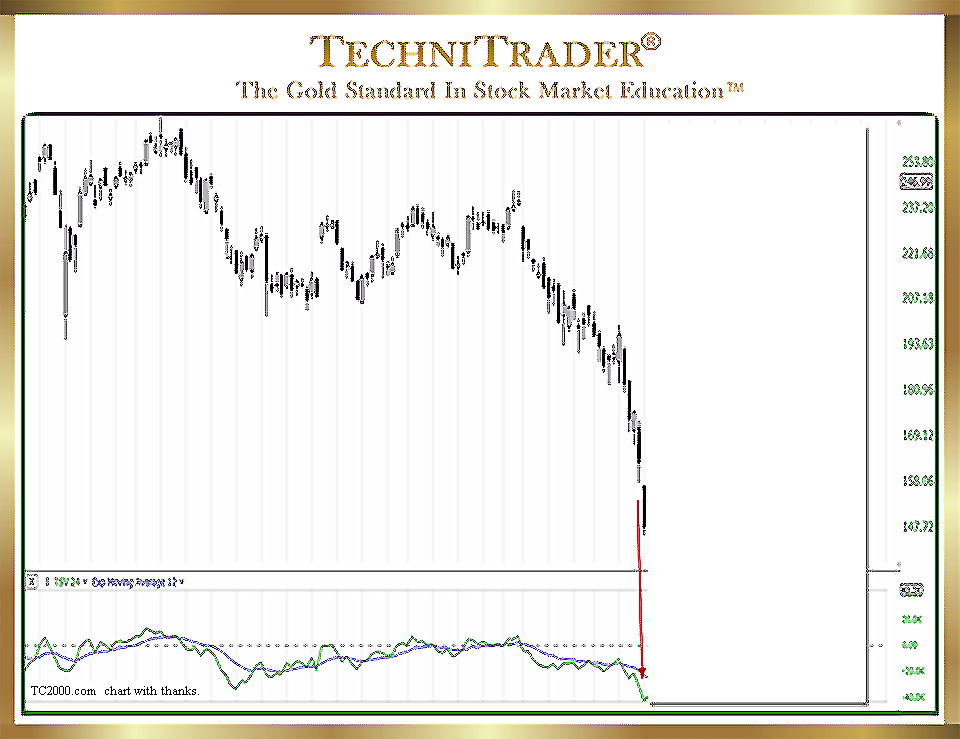
The chart example below shows one of the numerous signal patterns which Time Segmented Volume forms on a regular basis.

The stock has been in a selling mode for several weeks. The run is momentum at the moment, which often encourages Retail Traders to Sell Short. However, Time Segmented Volume has struck the bottom of its chart window and has ticked up on the down sell day. This is a contrarian pattern that frequently forms on Time Segmented Volume during momentum selling.
This contrarian pattern warns Retail Traders of the following 3 things:
- If you are Selling Short, it is time to exit the trade.
- Do not attempt to Sell Short, as the stock is about to reverse.
- Prepare for upside momentum action.
This is invaluable information that helps traders exit just before a big bounce or reversal, and it also tells them ahead of time to prepare for an upside momentum run.
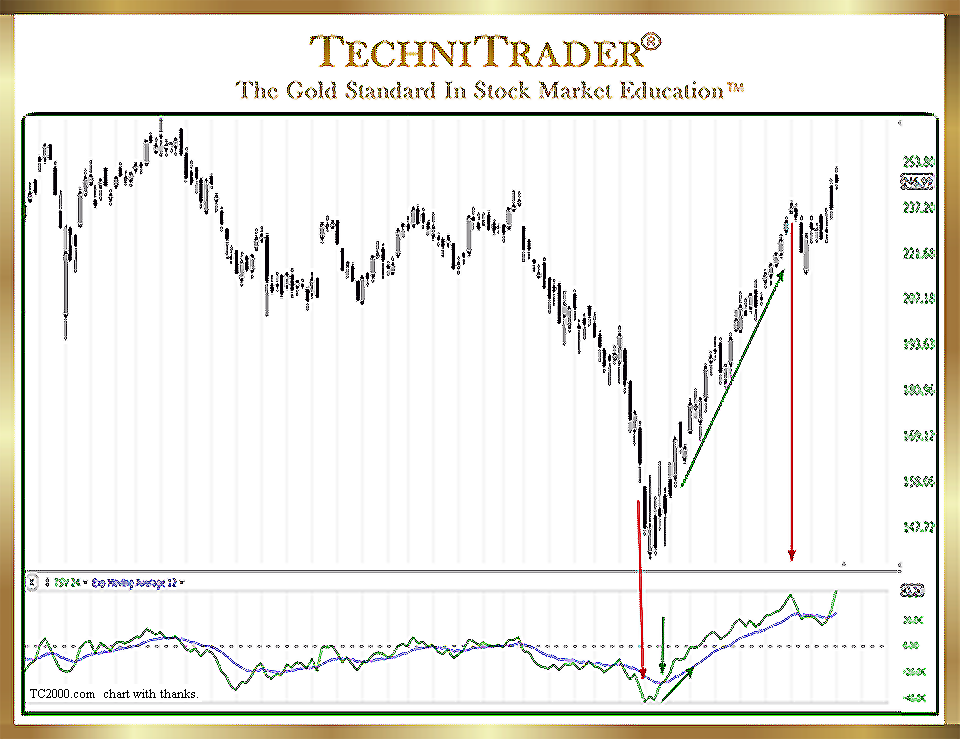
The Time Segmented Volume line crosses over its Subordinate Indicator, which is an Exponential Moving Average (EMA), signaling again early that the stock is going to bolt upward with momentum.

The stock runs 99 points upward before it has another Time Segmented Volume spike to the top of its chart window, this time warning that a selling-for-profit mode is about to start.
The stock ran with momentum runs that continued upward for over a month with minor profit taking. This provided several opportunities for Swing, Day, and Momentum Traders to enjoy great gains.
LEARN MORE at TechniTrader.Courses
Trade Wisely,
Martha Stokes CMT
TechniTrader technical analysis using TC2000 charts, courtesy of Worden Bros.
Chartered Market Technician
Instructor & Developer of TechniTrader Stock & Option Courses
Copyright ©2017–2025 Decisions Unlimited, Inc. dba TechniTrader. All rights reserved.
TechniTrader is also a registered trademark of Decisions Unlimited, Inc.
