How to Find Swing Trading Style Runs
Identify Momentum & Velocity Market Conditions Using Indicators
When the Stock Market moves with plenty of momentum and velocity activity, it provides opportunities for Swing Traders to hold a trade through a 1–10 day run up and then exit before the stock encounters profit taking.
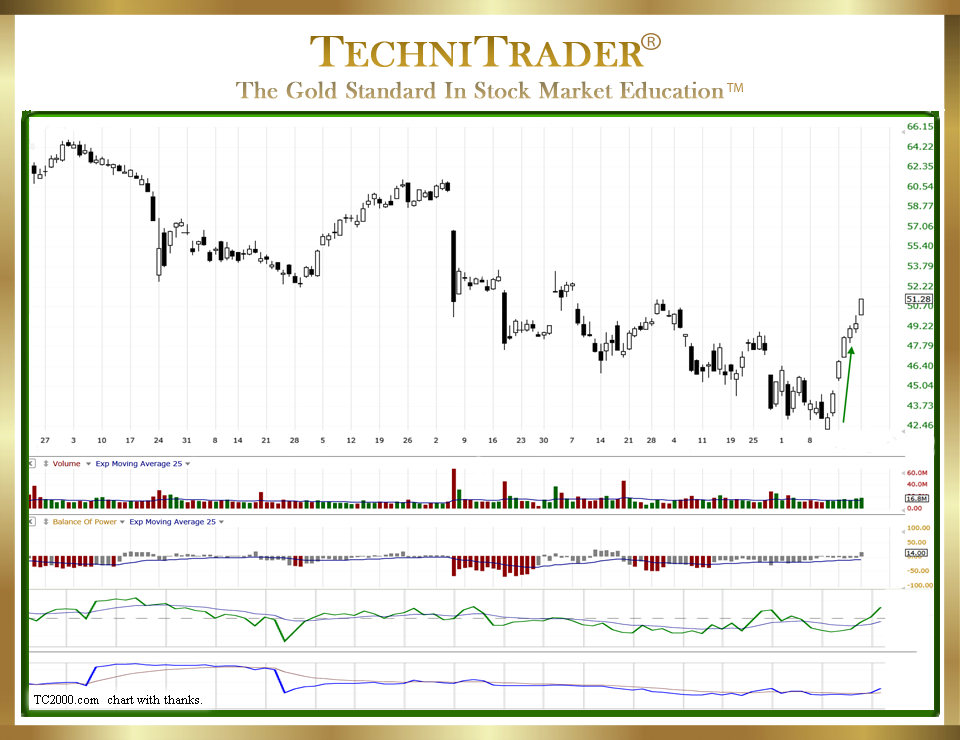
Below is a stock chart example with a Velocity Run.

Swing Trading requires the ability to quickly distinguish between a “Momentum Run” and a “Velocity Run”, which are both Swing Trading Style Runs. This is because each is different in how long you can hold the stock, how far it is likely to move, how it will behave when it meets resistance, and where to place Trailing Profit Stops. Many Swing Traders exit these stocks too soon.
If a Swing Trader exits too soon, they miss out on the significant profit potential Momentum Runs create. Therefore, it is critical to learn to distinguish between a Momentum Run and a Velocity Run. When a trader can see the distinct differences, the proper Trailing Profit Stops can be determined, which will allow the stock to run as far as it will go before exiting the trade.
Instead of settling for a 10- or 25-cent profit, Swing Traders can earn 3–20 points over a few days’ time with lower risk.
A Velocity Run, which is a Swing Trading Style Run, has several key elements which include the following:
- Stock Volume continues to rise during the run up, as shown in the top chart indicator window below price.
- Stock Volume declines before price reverses most of the time, again as shown in the top chart indicator window below price.
- Price does not overlap, and gaps are common.
LEARN MORE at TechniTrader.Courses
Trade Wisely,
Martha Stokes CMT
TechniTrader technical analysis using a TC2000 chart, courtesy of Worden Bros.
Chartered Market Technician
Instructor & Developer of TechniTrader Stock & Option Courses
Copyright ©2017–2025 Decisions Unlimited, Inc. dba TechniTrader. All rights reserved.
TechniTrader is also a registered trademark of Decisions Unlimited, Inc.
