How to Choose Stock Indicators
7 Tips for Selecting Best Indicators for the Stock Market Today
Stock Indicators are one of the most useful tools for Individual Investors and Retail Traders. However, choosing the right indicators for your Trading Style and Strategies can be a daunting task. There are over 250 indicators available in the Stock Market today for stock, index, market, and options analysis, so I am providing helpful 7 tips how to choose stock indicators.
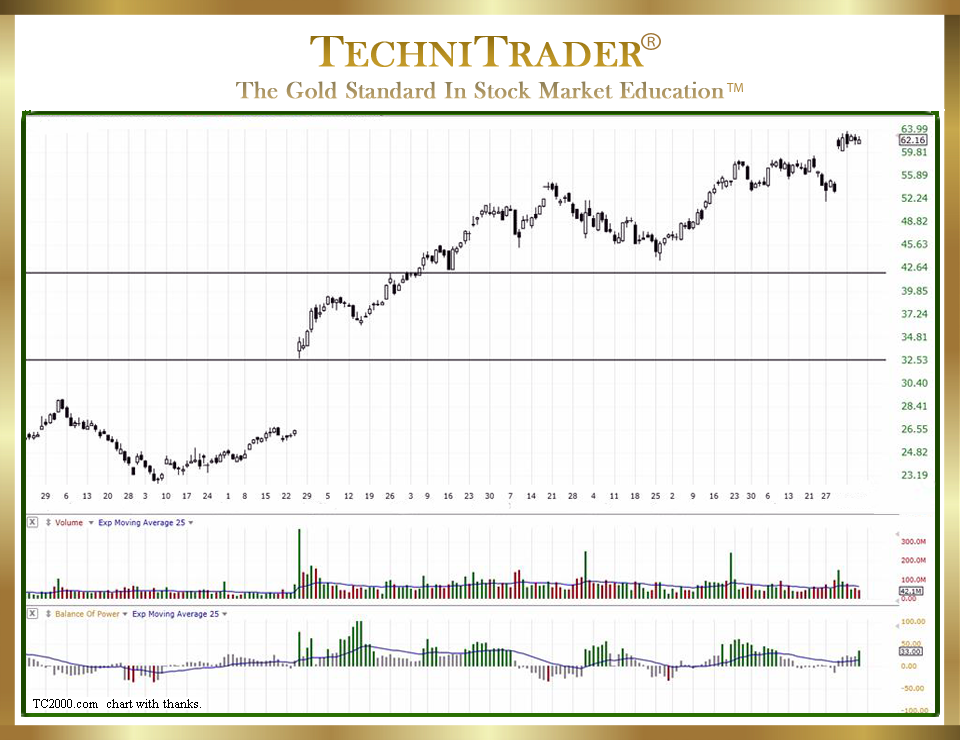
The candlestick chart example below shows Dark Pool Quiet Accumulation in the Balance of Power (BOP) indicator, which is located in the bottom chart window. This candlestick chart is of a stock prior to its earnings release.

Most beginners simply use what they hear about in a weekend seminar or read about on the internet. Unfortunately, just because an indicator is popular does not mean it is the best indicator for your Trading Style. More often than not when a trader uses an indicator that is widely promoted, they are unknowingly setting themselves up for chronic mediocre profits and whipsaw trades.
Consider the following 7 tips how to choose stock indicators for selecting the best ones for investing and trading in the Stock Market today.
- What is the Market Condition? This is not the uptrend or downtrend, but the overall condition of the market, which is derived from the Stock Market Participant Cycle. There are distinctly 9 Stock Market Participant Groups. Detecting if large lots versus small lots are buying or selling a stock is key for finding excellent stock trading momentum action BEFORE it happens. Where, when, and how they buy or sell dictates which of the 6 Market Conditions is present at any given time.
Usually, a Market Condition will dominate for several weeks to several months or longer. Above all else, the Market Condition dictates what indicators will work ideally at that time. - What was the indicator writer’s intent? This is critical to know because each writer developed their indicator based on a specific Market Condition that was present at that time. They saw Price and stock Volume behaving a certain way, and then wrote an indicator to expose that pattern and what it meant for investing or trading.
- What are the limitations of the indicator? Every indicator has strengths and weaknesses. As an example, it has been proven empirically that MACD only works during a momentum uptrend. It fails dismally for Sell Short Trading, and it creates whipsaw trades during Trading Range and Platform Market Conditions. Knowing the limitations helps traders avoid using that indicator in the wrong Market Conditions.
LEARN MORE at TechniTrader.Courses
Trade Wisely,
Martha Stokes CMT
TechniTrader technical analysis using a TC2000 chart, courtesy of Worden Bros.
Chartered Market Technician
Instructor & Developer of TechniTrader Stock & Option Courses
Copyright ©2015–2025 Decisions Unlimited, Inc. dba TechniTrader. All rights reserved.
TechniTrader is also a registered trademark of Decisions Unlimited, Inc.
