
How to Create a Bollinger Bands® Hybrid Leading Indicator
Use %B in Combination with Time Segmented Volume
Many traders do not know that there are several variations of Bollinger Bands designed by John Bollinger. One of those is %B, which is a Line Indicator that can be used with Time Segmented Volume (TSV) in the Worden Bros. TC2000 Charting Software. Together, they create a Hybrid Leading Indicator for Swing, Day, Momentum, and Options Trading.
Below is a chart showing a harmonic upside momentum-building phase before the breakout. The stock has been in a tight consolidation for a couple days. Time Segmented Volume and %B start to sync with Time Segmented Volume above %B.
LEARN MORE at TechniTrader.com
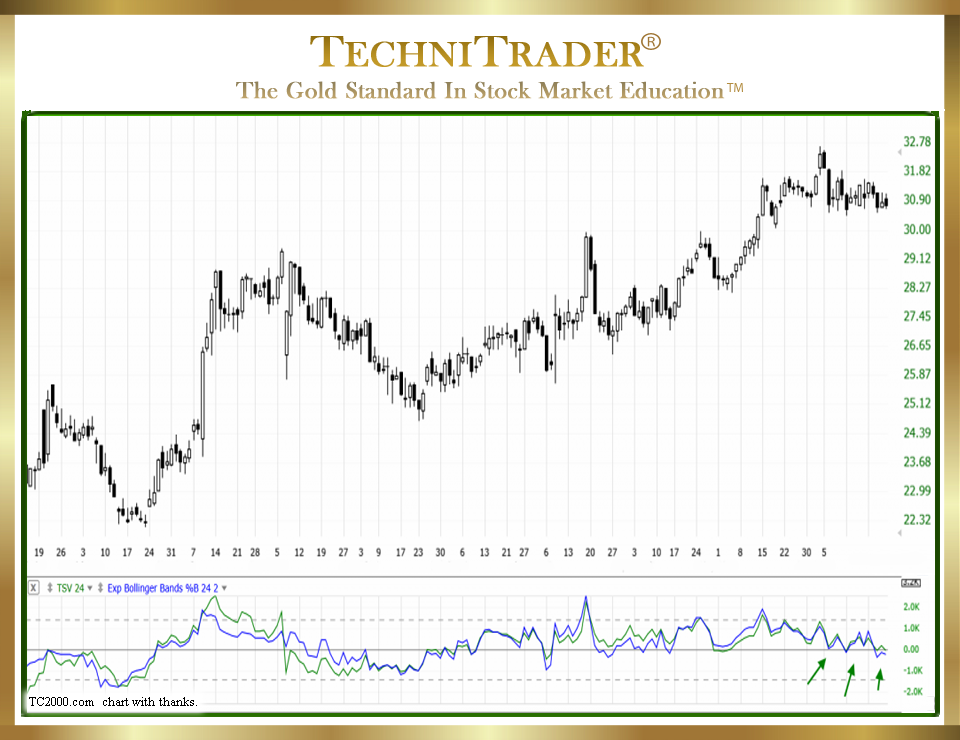
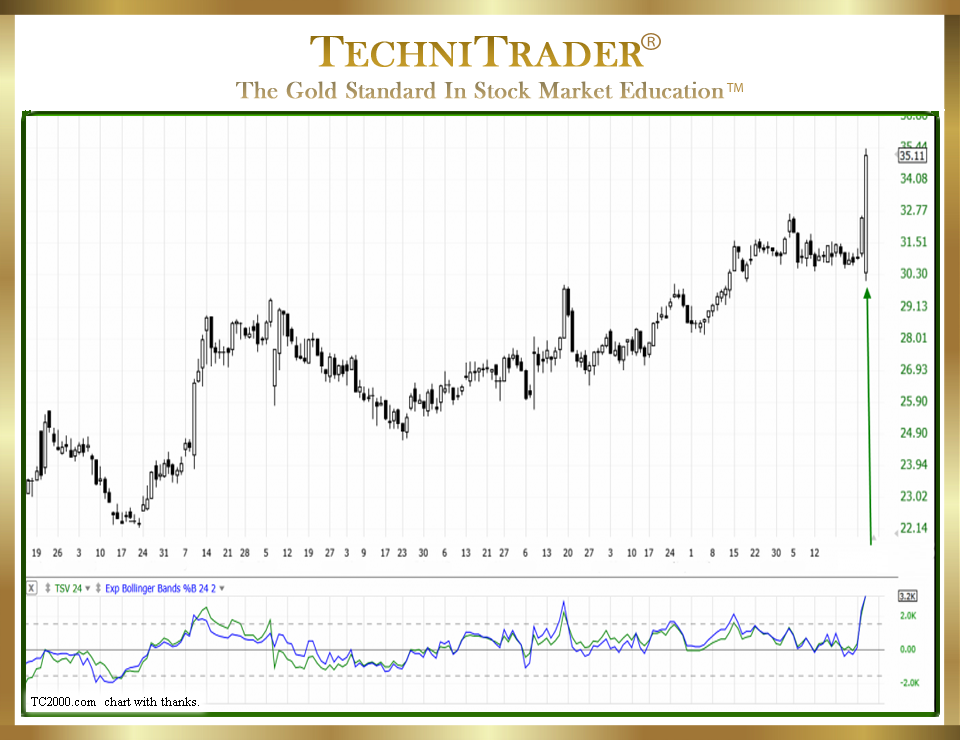
Momentum is building within this tightening consolidation, and it is confirmed by the indicator patterns. Then, the stock moved with sudden momentum. See the second chart example below.
LEARN MORE at TechniTrader.com
With Worden TC2000 Charting Software, traders have plenty of flexibility in setting up these indicators. The chart examples in this article use the Time Segmented Volume indicator and %B in the same indicator chart window. This provides a specific analysis that enables Retail Traders to interpret Price and stock Volume action in a unique way.
This indicator combination analysis approach is a TechniTrader-exclusive format. The combination of indicators completes the data set needed for fast and reliable analysis of both Price and stock Volume over time. This analysis is simple, straightforward, and easy to use.
Using Relational Technical Analysis™, which is the new approach to reading and interpreting stock charts, the goal is to identify harmonic patterns between Bollinger %B and Time Segmented Volume. This is just one of several different %B and Time Segmented Volume patterns that can be used for Stock or Options Trading.
Harmonic patterns between %B and Time Segmented Volume indicate that there are Professional Traders controlling Price at that time. Retail Traders should strive to trade with the Professional Traders rather than against them, which occurs most of the time with standard basic Retail Trading Systems.
The harmonic pattern is easy to see and provides the confirmation that Professional Traders are trading large lots, using their proprietary trading venues and routing systems to control Price entries. These are the most reliable of all momentum runs, and they offer higher profits with less risk and more consistent Price patterns.
Here are some basic tips for reading Time Segmented Volume and %B harmonic indicator patterns:
- Time Segmented Volume should be slightly above %B for a confirmation of upside momentum building.
- Time Segmented Volume should be below %B for a confirmation of downside momentum building.
- The closer the lines and the more in sync, the more harmonic the pattern.
Summary
Compression patterns and consolidations often break out suddenly without an easy way to identify the underlying momentum building that created the energy. By using Time Segmented Volume and %B together, the hidden momentum energy is revealed with their harmonic pattern.
LEARN MORE at TechniTrader.com
If you have not yet begun to trade or invest, go to Introduction: Learn How to Trade Stocks – Free Video Lesson to get started.
Learn the steps to trade like a pro with this introductory mini course. You will learn what it takes to create a Professional Trading Plan that can help you achieve your trading goals: How to Create a Professional Trading Plan
Trade Wisely,
Martha Stokes CMT
TechniTrader technical analysis using TC2000 charts, courtesy of Worden Bros.
Chartered Market Technician
Instructor & Developer of TechniTrader Stock & Option Courses
Copyright ©2017–2026 Decisions Unlimited, Inc. dba TechniTrader. All rights reserved.
TechniTrader is also a registered trademark of Decisions Unlimited, Inc.