Currently browsing category

StockCharts.com Blog

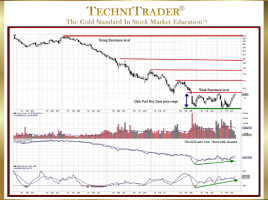
How to Position Trade Bottoming Stocks

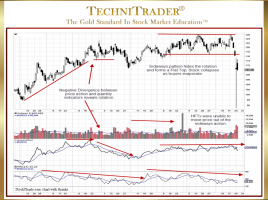
List of 5 What to Recognize in Candlestick Patterns Many traders do not have the time or resources to trade the most well-known Trading Styles, which are Day Trading and Swing Trading. Both of these styles require more time, a higher capital base, and the ability to be trading in …

How to Determine a Downtrend Is Reversing

Use Leading Indicators to Identify Confirmation Technical Traders and Retail Traders need to be able to identify Reversal Candlestick Patterns during a Downtrend in order to avoid huge losses on Selling Short Trades and to be prepared and ready for early entry in the reversal of the trend. When a …

How to Sell Short Using a Swing Trading Style

Learn to Identify Trading Entry Candlestick Patterns The stock chart example below shows a Flat Top Candlestick Pattern for Sell Short Swing Trading. This setup has strong run gain potential as the stock falls from its Topping Candlestick Pattern. The chart also shows examples of a High Frequency Trader (HFT) …

What Are 5 Tips for Sell Short Success?

New Topping Candlestick Patterns List and New Entries & Exits Selling Short is a Trading Style few Retail Traders and Technical Traders use even during major Bear Markets. The reason is because it is often far more challenging to understand the technical patterns of the downtrend which include 5 Tips …

Why Use Stock Volume and Quantity Analysis?

To Identify Price Action by Stock Market Participant Groups Before there were High Frequency Traders (HFTs), Dark Pools, Twilight Pools, and an 80% automated marketplace, the most important indicator was price. Many Retail Traders learned to simply rely upon price action and rarely considered stock volume or quantity analysis. Chart …

6 pages