Currently browsing tag

Dark Pools

Why Use Inverted Technical Analysis™?

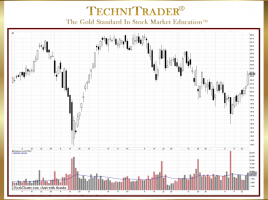
Determine If a Stock Is a Retracement or Sell Short When Retail Traders are already in a stock and it starts to move down rather than up, many do not know whether to sell the stock or hold it. They are uncertain whether the move down is just a retracement …

Why Use Stock Volume and Quantity Analysis?

To Identify Price Action by Stock Market Participant Groups Before there were High Frequency Traders (HFTs), Dark Pools, Twilight Pools, and an 80% automated marketplace, the most important indicator was price. Many Retail Traders learned to simply rely upon price action and rarely considered stock volume or quantity analysis. Chart …

How to Choose Stock Indicators

7 Tips for Selecting Best Indicators for the Stock Market Today Stock Indicators are one of the most useful tools for Individual Investors and Retail Traders. However, choosing the right indicators for your Trading Style and Strategies can be a daunting task. There are over 250 indicators available in the …

tracking_quiet_accumulation

Tracking Institutional Investors

Quiet Accumulation/Distribution Indicators The task of finding a simple reliable method for tracking the quiet accumulation of institutional investors in the stock market was no small feat for me many years ago. Market indicators track mostly indexes, advancing versus declining stocks, breadth, and so on which all basically track price …

Trading Range Compression Patterns

Early Entry with Proper Confirmation Spatial Pattern Recognition Skills™ are a technique and skill that needs to be continually improved as technical traders gain experience, and can read charts to interpret candlesticks and indicators with more sophisticated abilities. SPRS takes time to develop but is essential to a full-time career …

downside_action_automated_market

How to Identify Dark Pool Rotation Patterns

Downside Action in the Automated Stock Market Recently, the news media for the retail side of the market stated that the correction the market was experiencing during that week was caused by “investors reaction to the dollar value rising and the risk of the Feds raising interest rates.” Although this …

Candlestick Charts

Candlestick Charts continue to rise in popularity; however, most traders and investors are unaware of the fact that many of the Japanese candlestick patterns, taught in books and generally around the internet in articles no longer form or are as reliable as they were 20 years ago. What has happened …

4 pages