Currently browsing tag

High Frequency Traders

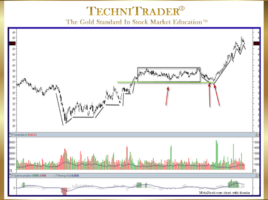
How to Identify Selling Short Bounce Areas

Determine Levels and Strength of Support Topping patterns have undergone dramatic changes in the past decade due to Market Structure changes which have created new types of venues, orders, routing, and Market Participants. Once the new topping formations are identified, the next analysis must be where small and minor non-reversal …

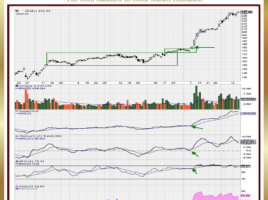
Why Use Balance of Power to Find Dark Pools?

For Identifying Stocks Poised for Momentum Runs Balance of Power (BOP) is an extremely rare and unique indicator. Its origins come from the professional side of the market. It is designed to separate out large-lot activity from small-lot activity. This kind of stock volume aka quantity analysis on the tick-by-tick …

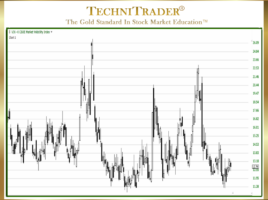
How to Go Beyond Basic Candlestick Pattern Analysis

Recognizing Who Is Controlling the Stock Price There is a plethora of analysis training on Candlestick Patterns and interpretation, and yet this remains one of the most problematic areas for Technical Traders who want to trade at the expert level earning high income from just trading stocks. The candlestick chart …

How to Identify Downside Breakouts Prior to a Top

Recognize Shift of Sentiment™ Patterns in Indicators One of the more frustrating patterns for many Technical Traders and Retail Traders are the Flat Top Candlestick Patterns that form today. These new Topping Formations surprise many traders and result in whipsaw trades and losses with breakouts to the downside. What appears …

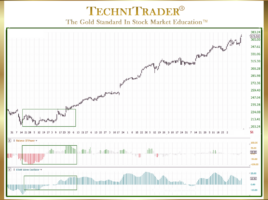
What Is the Anatomy of a Swing Trade?

Identifying Large Lots Dominating Buy Side or Sell Side of Momentum Run The most common mistake Retail Traders make in choosing stocks for Swing Trading is to not identify whether the large lots are dominating the buy side or the sell side during the price action momentum run upward. This …

4 pages