Currently browsing tag

stock volume

Why Trade Small Cap Stocks?

Trade with the Professional Traders for Higher Point Gain Potential Many Retail Technical Traders are still unaware of a gold mine of trading opportunities that can yield higher profits due to wider spreads. The Securities and Exchange Commission (SEC) started a test pilot program for small cap stocks a couple …

How to Improve Bollinger Bands®

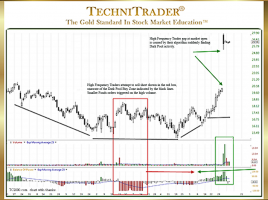
Add Quantity Indicators to Analysis for Stock & Options Trading One of the most exasperating things that happen to Retail Traders and Technical Traders is to find a chart with a perfect setup but the stock has already gapped or ran up with a huge one-day gain, as High Frequency …

Why Learn Dark Pool Candlestick Patterns?

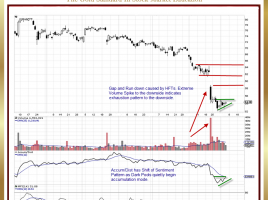
To Enter Stocks Prior to Velocity Runs Dark Pools use precise controlled orders that trigger automatically over extended periods of time. Since the Buy Side Institutions using the Dark Pools are primarily buying for the long term, price can sometimes drop down before moving up. This tendency often leaves Retail …

What Are Spatial Pattern Recognition Skills™?

Reading Stock Charts Like the Professional Traders All Technical Traders need to have very high visual pattern skill development so that they can click through charts quickly and identify patterns that they prefer to trade. Unfortunately for most Retail Traders, this skill is underdeveloped, leaving them to rely too much …

How to Find Stocks to Trade Faster

5 Tips Include Identify Candlestick Price Action Oftentimes, traders just cannot find great stock picks quickly and easily. This leads many traders to resort to relying upon news, recommendations from gurus, social media, or online trading chat rooms. Unfortunately for those traders, High Frequency Traders (HFTs) and other predatory systems …

How to Go Beyond Basic Candlestick Pattern Analysis

Recognizing Who Is Controlling the Stock Price There is a plethora of analysis training on Candlestick Patterns and interpretation, and yet this remains one of the most problematic areas for Technical Traders who want to trade at the expert level earning high income from just trading stocks. The candlestick chart …

Why Analyze Sideways Bottoming Stock Trends?

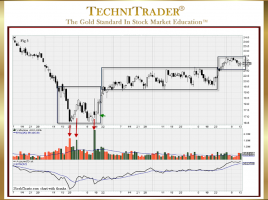
To Identify Dark Pool Buy Zones™ The Shift of Sentiment™ pattern in the stock chart example below clearly and easily shows that Buy Side Institutions using Dark Pools entered this stock and would quickly take control of price. Sideways bottoming stock trend analysis of the chart shows that a sudden …

5 pages