Currently browsing tag

Swing Trading

Why Are Quantity Indicators Most Important?

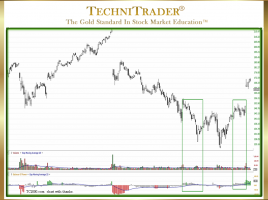
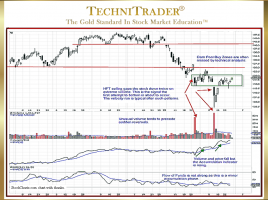
They Reveal Dark Pool Quiet Accumulation Momentum Runs are not perpetual. At some point, Professional Technical Traders, who are one of several drivers behind Momentum Runs, will take profits at technical resistance levels. The chart example below is an excellent example of why so many Swing Traders using Stop and …

What Is the Power in Platform Candlestick Patterns?

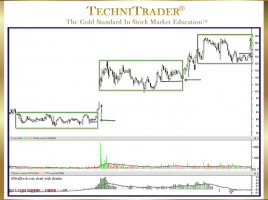
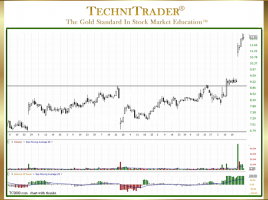
Buy Side Institutions Buying in Dark Pools Prior to Runs The “Platform Candlestick Pattern” is a relatively new sideways candlestick pattern that is becoming more and more prevalent as the Dark Pools’ activity increases. Dark Pools are Alternative Trading System (ATS) venues that transact giant-lot orders off of the Exchanges. …

How to Find the Giant Buy Side Institutions

Identify Platform Candlestick Patterns for Low Risk & Early Entry The giant Buy Side Institutions control vast amounts of money on behalf of their fundholders. They are the giant Mutual Funds and Pension Funds in the US and around the world. Most of the time, Individual Investors and Retail Traders …

What Are 5 Sell Short Tips During a Market Correction?

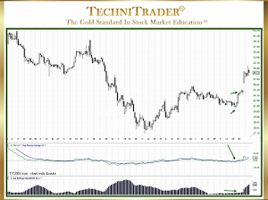
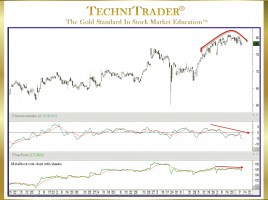
Recognizing Platform Candlestick Patterns™ There have been many changes to the technical patterns of the downside in recent years. Knowing what to study in technical patterns to improve profits is necessary in order to successfully Sell Short stocks during a Market Correction. Here are 5 Sell Short tips for stocks …

How to Find Swing Trading Style Runs

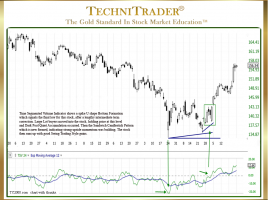
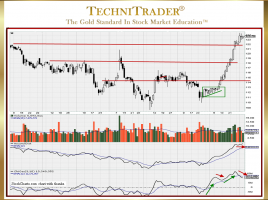
Identify Momentum & Velocity Market Conditions Using Indicators When the Stock Market moves with plenty of momentum and velocity activity, it provides opportunities for Swing Traders to hold a trade through a 1–10 day run up and then exit before the stock encounters profit taking. Below is a stock chart …

Why Is the Weekly Chart View Invaluable?

For Interpreting What Price Will Do After Stock Volume Spikes The chart example below with a Daily Chart View shows that High Frequency Traders (HFTs) caused a huge white candlestick and stock Volume spike, as indicated by the vertical red line on the right. Since then, this stock has been …

4 pages