Currently browsing tag

Velocity Run

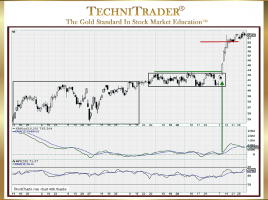
How to Find Swing Trading Style Runs

Identify Momentum & Velocity Market Conditions Using Indicators When the Stock Market moves with plenty of momentum and velocity activity, it provides opportunities for Swing Traders to hold a trade through a 1–10 day run up and then exit before the stock encounters profit taking. Below is a stock chart …

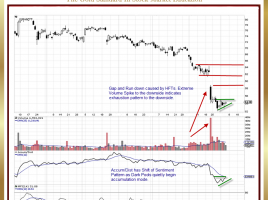
How to Interpret Extreme Candlestick Patterns

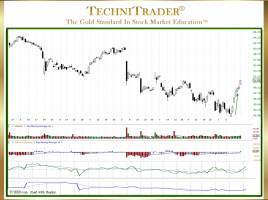
Identify Dark Pool Buy Zones™ in Stock Bottom Formations Every Technical Trader and Retail Trader knows that Bottom Formations are often completed with a Momentum or Velocity Run, but few are able to capture those big gains because they are unable to recognize the candlestick patterns that precede the run. …

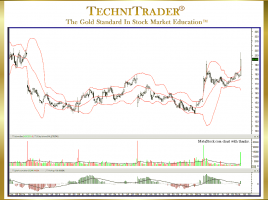
How to Use Bollinger Bands® in MetaStock Charts

Add Stock Volume Indicators for Direction Stock Will Move The Bollinger Bands indicator has been gaining in popularity. This is no surprise, given the changes in the Market Structure and how price behaves with more of the Exchanges, Dark Pool Alternative Trading Systems (ATSs), Electronic Communication Networks (ECNs), and other …