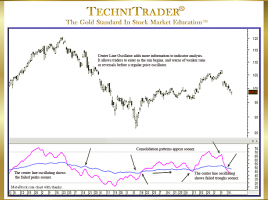
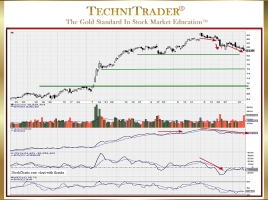
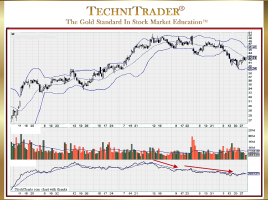
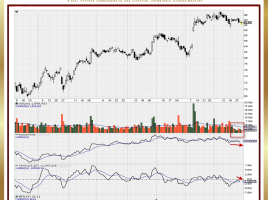
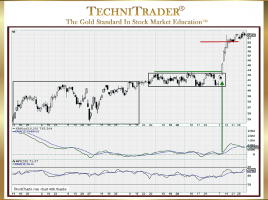
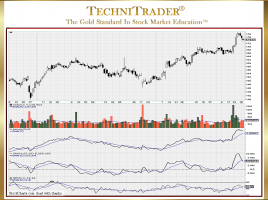
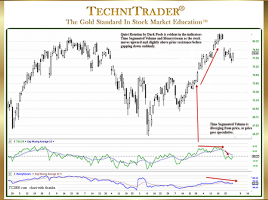
How to Use and Interpret a Center Line Oscillator

Moves in Opposition to Price During Volatile Market Conditions Most Technical and Retail Traders are familiar with high and low range oscillators or what is often called an Overbought or Oversold Oscillator. However, few really understand or use a Center Line Oscillator, which is extremely useful during Volatile Market Conditions …

What Is the Best Way for Trading Options?

Use Stock Chart Analysis Options Trading requires that you know more than just options chains, puts and calls, and other basics. Options Trading for beginners is often confusing and overwhelming and can result in a significant loss of your capital base unless you learn right from the get-go that trading …

How to Find Stocks to Trade Faster

5 Tips Include Identify Candlestick Price Action Oftentimes, traders just cannot find great stock picks quickly and easily. This leads many traders to resort to relying upon news, recommendations from gurus, social media, or online trading chat rooms. Unfortunately for those traders, High Frequency Traders (HFTs) and other predatory systems …

Why Use Balance of Power to Find Dark Pools?

For Identifying Stocks Poised for Momentum Runs Balance of Power (BOP) is an extremely rare and unique indicator. Its origins come from the professional side of the market. It is designed to separate out large-lot activity from small-lot activity. This kind of stock volume aka quantity analysis on the tick-by-tick …

How to Use Balance of Power for Early Entry into Stocks

Shift of Sentiment™ Signals Momentum Energy Is About to Occur TC2000.com Users have a huge advantage over other Retail Traders as they have access to 3 of the most powerful indicators for the markets today which are automated with multi-venues for Stocks and Options. The complexity of the modern markets …

How to Go Beyond Basic Candlestick Pattern Analysis

Recognizing Who Is Controlling the Stock Price There is a plethora of analysis training on Candlestick Patterns and interpretation, and yet this remains one of the most problematic areas for Technical Traders who want to trade at the expert level earning high income from just trading stocks. The candlestick chart …

How to Identify Downside Breakouts Prior to a Top

Recognize Shift of Sentiment™ Patterns in Indicators One of the more frustrating patterns for many Technical Traders and Retail Traders are the Flat Top Candlestick Patterns that form today. These new Topping Formations surprise many traders and result in whipsaw trades and losses with breakouts to the downside. What appears …

What Is Dark Pool Quiet Rotation™?

Candlestick Patterns Explained with Stock Indicators Most Technical and Retail Traders have heard about Buy Side Institutions’ Dark Pool Quiet Accumulation and Quiet Distribution, but few understand another institutional action which is Dark Pool Quiet ROTATION. The candlestick chart example below with a monthly view shows the commencement of a …

19 pages