How to Go Beyond Basic Candlestick Pattern Analysis
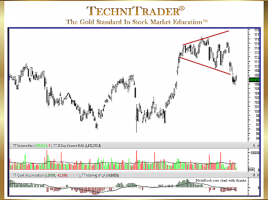
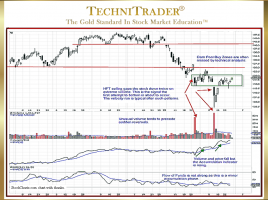
Recognizing Who Is Controlling the Stock Price There is a plethora of analysis training on Candlestick Patterns and interpretation, and yet this remains one of the most problematic areas for Technical Traders who want to trade at the expert level earning high income from just trading stocks. The candlestick chart …