
Wilder’s Relative Strength Index with Bollinger Bands
Improves Candlestick Chart Analysis
Wilder’s Relative Strength Index RSI is far superior to all other price oscillators due to the fact that it not only oscillates, but it also is a relational comparative indicator. As a comparative indicator, it has far more signals and patterns that form on a candlestick chart than any other price oscillator. As a relational indicator, the relationship between RSI and line volume as well as other indicators, is extremely useful for finding volume to price divergences, convergences, deviations, extreme patterns and so on.
RSI is not as simple to learn as Stochastic which is the first oscillator most traders start out with because it is such a basic oscillator lacking the subtle nuances of the more sophisticated formula of RSI. Wilder’s RSI was also written during a recession and new growth era similar to the type of economic conditions we have right now, whereas Stochastic was written during a Trading Range market of the early 1950’s.
Using Bollinger Bands with RSI is a new concept for most retail traders. John Bollinger was a great indicator writer. He created a highly versatile indicator that can be used on not only price charts but also on most indicators, excluding the bar aka histogram indicators such as Volume. When Bollinger Bands are placed on top of RSI in the same chart window, a whole new view and perspective of RSI emerges. It is like turning on headlights or replacing a black and white TV with a color model.
Suddenly a wealth of information is more easily seen for clearer interpretations. Below are two chart examples with daily views, to show how to use Bollinger Bands with RSI for a far superior analysis of the best price oscillator for today’s markets.
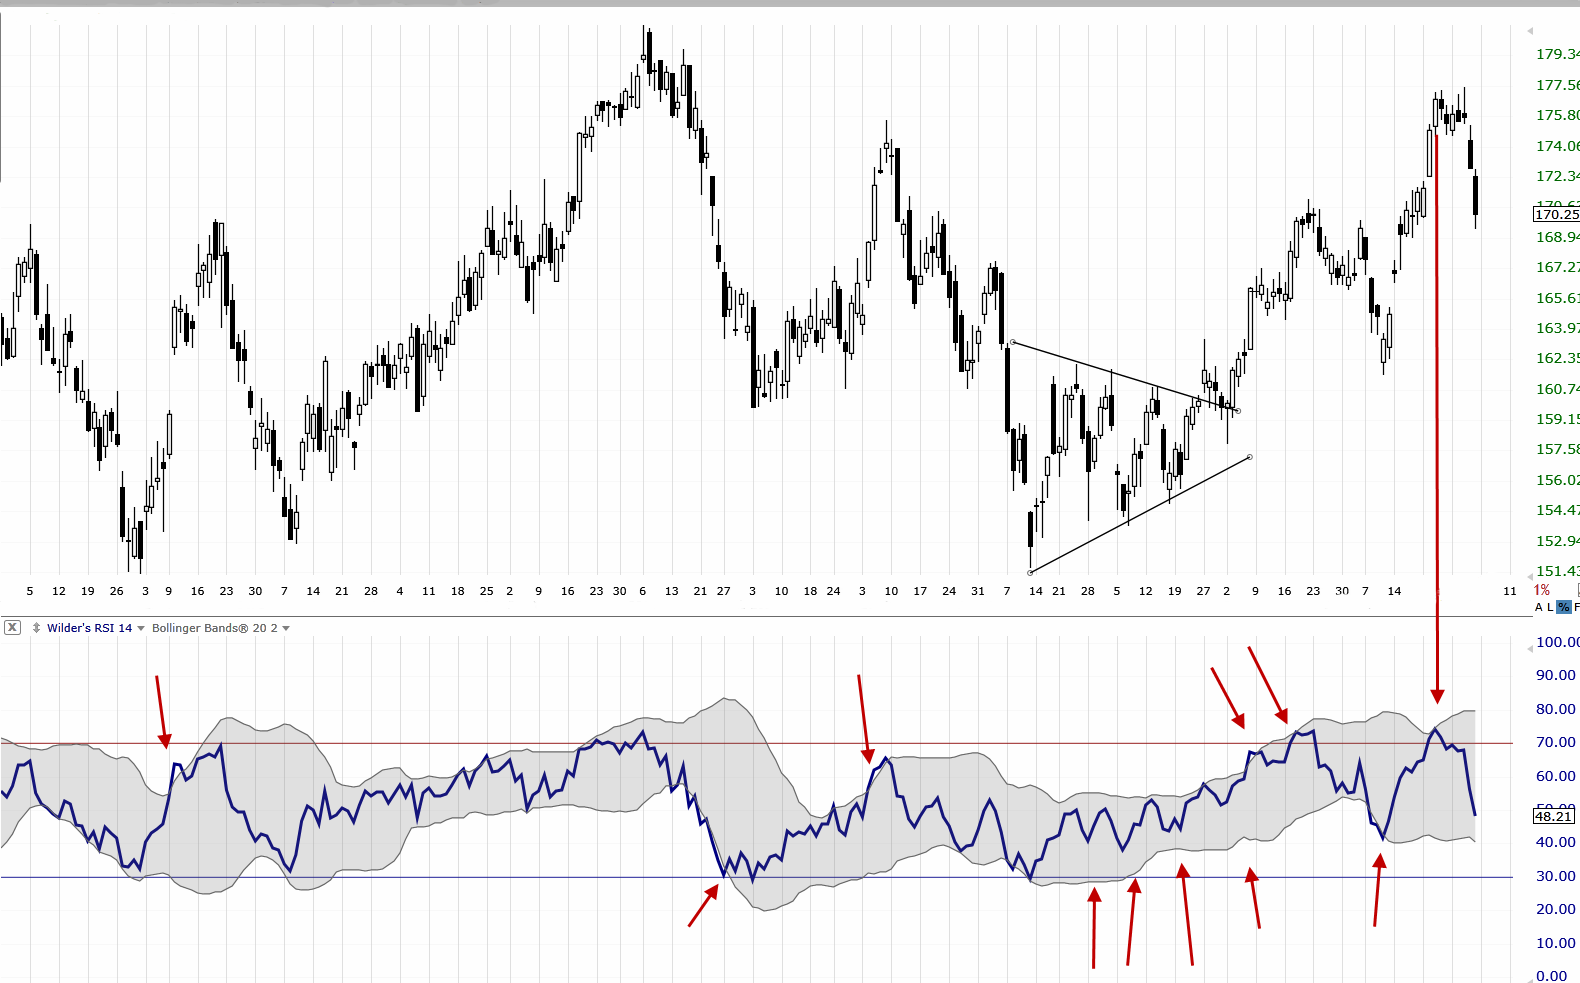
The first chart example shows just how often Bollinger Bands exposes an extreme RSI condition, even before RSI does on its own. That single day warning can save retail traders from holding too long, or from entering at an extreme risk level.
 For this example the traditional period settings for Bollinger Bands are being used on RSI. However, each individual retail trader can adjust these settings to their own unique trading style and preferences.
As shown on price, a symmetrical triangle formed with a very consistent shape. The RSI indicator compressed as it compared current price to prior price, showing a precise and consistent price pattern not evident in the candlesticks themselves. Bollinger Bands exposes an overextended RSI before the stock retraced. In addition the low of the Bollinger Bands shows that the stock had hit its low for that retracement, warning short sellers not to sell the stock short but to buy-to-cover quickly. See the long red arrow where the candlestick consolidation looked as if the stock would move up further, however Bollinger Bands on RSI warned it would not.
The second chart example shows that the candlestick price pattern is definitely a Trading Range.
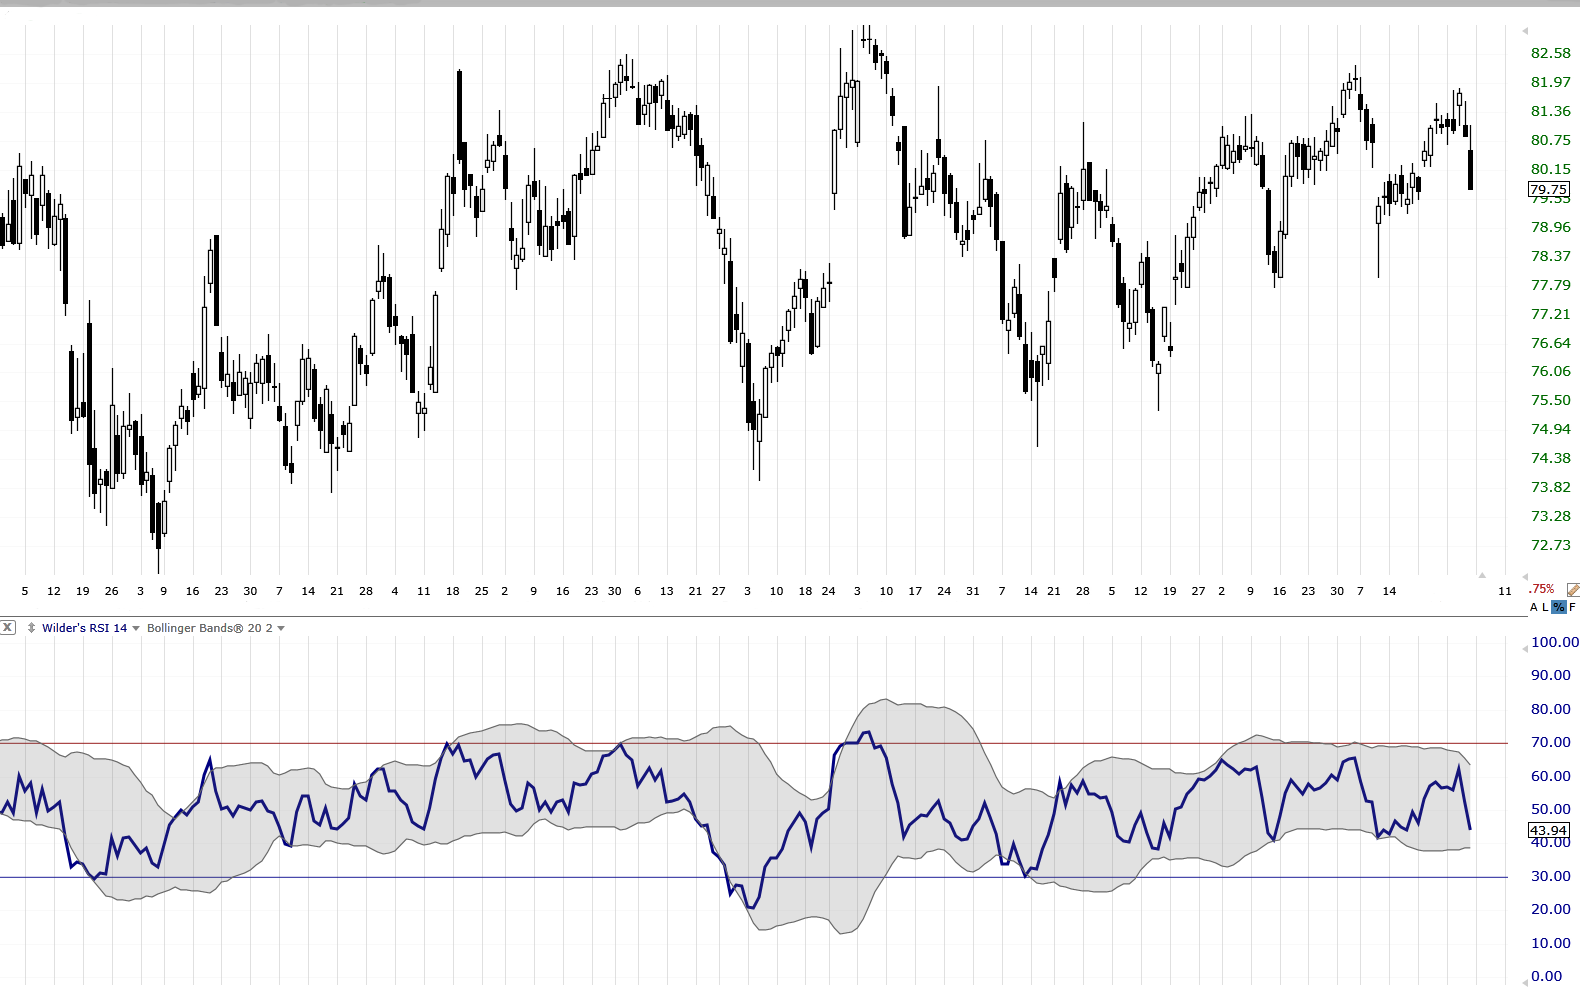
However, even before trendlines are drawn, RSI and Bollinger Bands show that this is a compressing Trading Range. It is compressing more on the lower range than the upper range, which is very important to recognize. The last 2 peaks are lower, which is a change to the pattern that means the symmetrical triangle is near completion. Being able to see these lower peaks and higher lows for this Trading Range, helps retail traders prepare for the breakout pattern ahead of time. Since the peaks are now dropping and not breaching the Bollinger Bands, pressure is increasing to the downside at this time.
Summary
The Wilder’s Relative Strength Index indicator is an excellent oscillator for short term trading. It has the ability to create signals and patterns that are not as easily recognized with most price oscillators. Bollinger Bands placed over RSI help to identify divergences, convergences, deviations, extreme peaks, and extreme troughs even if RSI doesn’t cross its 30/70 overbought and oversold lines. Bollinger Bands often expose an extreme prior to the stock reversing or turning. This combination is ideal for Trading Range bound stocks where intra-level support and resistance can cause whipsaw action. By using RSI with Bollinger Bands, the risk at support and resistance levels is more easily seen.
I invite you to visit my website at www.TechniTrader.Courses
Trade Wisely,
Martha Stokes CMT
Chartered Market Technician
Instructor & Developer of TechniTrader Stock & Option Courses
Copyright ©2017–2024 Decisions Unlimited, Inc. dba TechniTrader. All rights reserved.
TechniTrader is also a registered trademark of Decisions Unlimited, Inc.
Disclaimer: All statements, whether expressed verbally or in writing are the opinions of TechniTrader its instructors and or employees, and are not to be construed as anything more than an opinion. Readers are responsible for making their own choices and decisions regarding all purchases or sales of stocks or issues. TechniTrader is not a broker or an investment advisor; it is strictly an educational service.