Wilder’s Relative Strength Index (RSI) Indicator vs. Stochastic
RSI Indicator Exposes Bottoming Stock Formation Strength Prior to Gaps
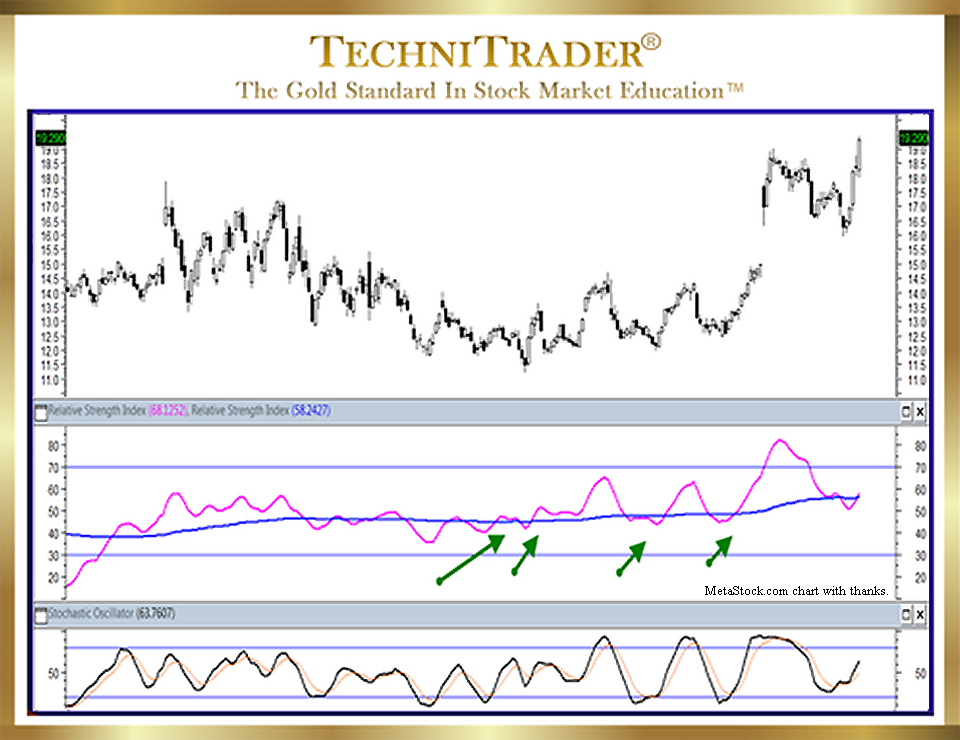
Wilder’s Relative Strength Index (RSI) has added analysis depth when using the center line oscillation feature. Instead of looking at merely Overbought/Oversold patterns of highs and lows, when Wilder’s Relative Strength Index indicator starts to waver around its center line, it exposes the bottoming pattern of the stock before it gaps up. Wilder’s Relative Strength Index is highly adaptable and easily modified. Below in the middle chart window is an example of how I set up this indicator for my TechniTrader Students.

By comparison, the Stochastic indicator in the bottom chart window, as it is traditionally used strictly for Overbought/Oversold signals, is not exposing the bottoming action underway in the chart example. The oscillation actually causes whipsaw risks during this bottoming phase.
Using Wilder’s Relative Strength Index RSI indicator to expose the strength of the bottom via a center line that floats with price direction tells you far more about the strength of the sideways candlestick pattern and the decided upside direction, even though price is still sideways.
In addition, Wilder’s Relative Strength Index is a very different formula compared to the Stochastic indicator. Wilder wrote it to expose whether the current price was stronger or weaker than “X period” or number of days ago. Therefore, what you are looking at is a Relative Strength relationship between the current price and “x number of periods” aka days ago.
LEARN MORE at TechniTrader.Courses
Trade Wisely,
Martha Stokes CMT
TechniTrader technical analysis using a MetaStock chart, courtesy of Innovative Market Analysis, LLC dba MetaStock
Chartered Market Technician
Instructor & Developer of TechniTrader Stock & Option Courses
Copyright ©2017–2024 Decisions Unlimited, Inc. dba TechniTrader. All rights reserved.
TechniTrader is also a registered trademark of Decisions Unlimited, Inc.
