
What Are the 5 Key Aspects of Technical Analysis?
Candlestick Patterns Reveal Who, What, Where, When, and Why
Technical Analysis is the study and interpretation of price, time, and stock volume for stocks and indexes. Due to the massive changes to the Stock Market Structure since the Banking Debacle and Subprime Mortgage disaster, Technical Analysis has been evolving and changing. There are many aspects of Technical Analysis including Candlestick Patterns, Support and Resistance, Trendline Patterns, Angle of Ascent™ and Angle of Descent™, as well as Overall Trend, Uptrend, Downtrend, Sideways Trending, Institutional activity, High Frequency Trader (HFT) activity, Small Fund and Retail activity, Entry and Exit Signals, and Indicators.
All of this can be simplified down to 5 areas of stock analysis which makes stock pick selection faster, easier, and far more reliable.
Here is a list of the 5 Key Aspects of Technical Analysis to analyze and interpret:
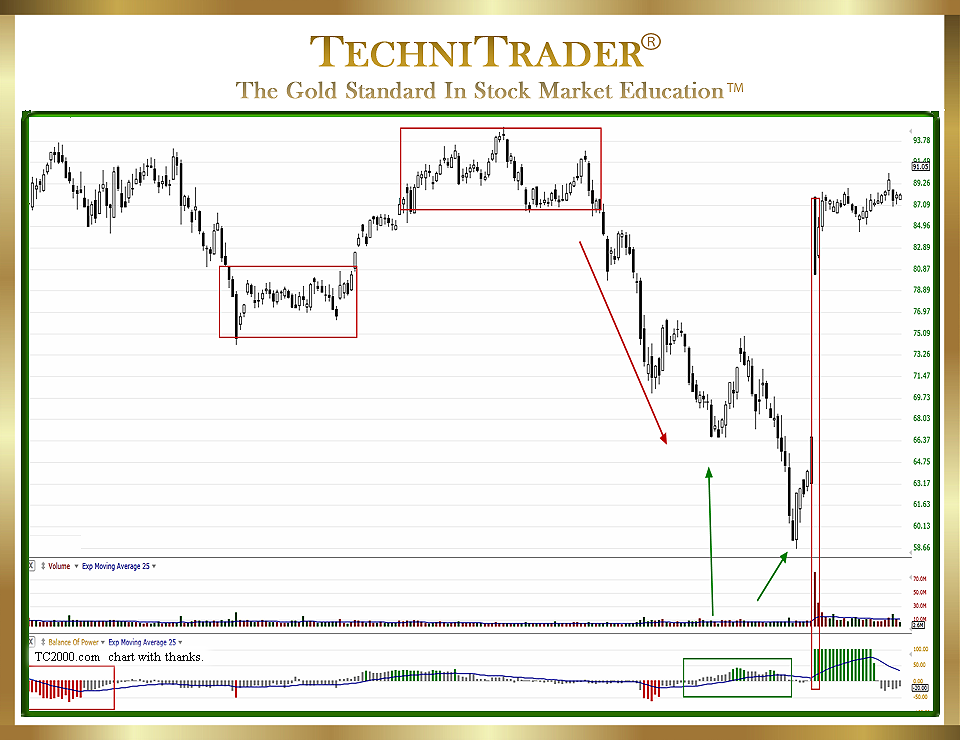
1. WHO is all about which of the 9 Stock Market Participant Groups created that price action. Trading Range price action is not created by the giant Buy Side Institutions that use Dark Pools. Trading Ranges tend to form when several different Smaller Lots and High Frequency Traders are disagreeing on the direction the stock will take. Sentiment is fractured, and neither the buy side nor the sell side controls price sufficiently to sustain the uptrend or the downtrend.
LEARN MORE at TechniTrader.Courses
Trade Wisely,
Martha Stokes CMT
TechniTrader technical analysis using a TC2000 chart, courtesy of Worden Bros.
Chartered Market Technician
Instructor & Developer of TechniTrader Stock & Option Courses
Copyright ©2017–2024 Decisions Unlimited, Inc. dba TechniTrader. All rights reserved.
TechniTrader is also a registered trademark of Decisions Unlimited, Inc.