
What Is the Anatomy of a Sell Down Momentum Run?
List of Differences Between Upside & Downside Candlesticks
During an Intermediate-Term Correction caused by several major industries in an industry cycle Bear Market, Sell Down Momentum Runs can be a lucrative trading method for Swing, Day, and Momentum Traders who know how to Sell Short or trade “put” Options.
See the anatomy of a Sell Down Momentum Run in the chart example below.
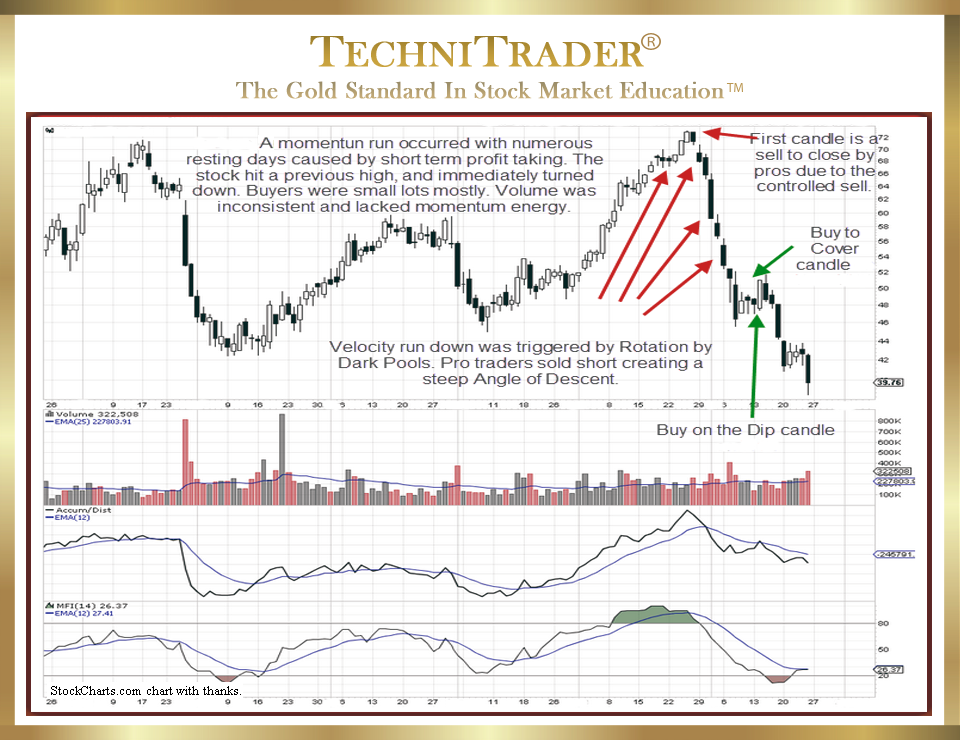
This chart example shows who is selling, who is Selling Short, which Stock Market Participant Groups are Buying the Dip assuming this is not an Intermediate-Term Correction, and the Buy to Cover action by Professional Traders who sold short.
Each type of candlestick and stock volume bar tells the Technical Trader a great deal about which Stock Market Participant Group dominated at each stage of the Downside Momentum Run.
Dark Pools had started Quiet Rotation™ prior to the top, and their action is always very tight price patterns on below-average stock volume as the selling is automated and incremental.
Professional Traders who were helping the run up sold as price entered the technical resistance level from the prior high. The resistance price black profit-taking candlestick is precisely placed, small, and exactly at the prior high. This is a technical candlestick created by Technical Professional Traders.
The Dark Pools’ orders continued to trigger as the stock moved down the next two days. The longer black candlestick formed as Stop Losses triggered. Dark Pools ceased their selling due to an increase in stock volume.
Momentum from Stop Losses triggering and Sell Short Professional Traders drove price down further. Near the lows of May, uninformed Buy the Dip strategy investors bought the stock, moving it up temporarily. That action was followed by more selling, which at this time was by disillusioned smaller lots. Professional Traders placed Buy to Cover orders the next day. Two resting-day candlesticks followed as Buy the Dip investors were unable to move price. On the third day, a long white candlestick formed as Buy the Dip investors and Retail Traders bought. However, the run down was not finished, and Professional Traders resumed Selling Short.
LEARN MORE at TechniTrader.Courses
Trade Wisely,
Martha Stokes CMT
TechniTrader technical analysis using a StockCharts chart, courtesy of StockCharts.com
Chartered Market Technician
Instructor & Developer of TechniTrader Stock & Option Courses
Copyright ©2015–2024 Decisions Unlimited, Inc. dba TechniTrader. All rights reserved.
TechniTrader is also a registered trademark of Decisions Unlimited, Inc.