
How to Improve Bollinger Bands®
Add Quantity Indicators to Analysis for Stock & Options Trading
One of the most exasperating things that happen to Retail Traders and Technical Traders is to find a chart with a perfect setup but the stock has already gapped or ran up with a huge one-day gain, as High Frequency Trading algorithms triggered the gapping or running up of the stock in the first few minutes of the trading day.
Many traders want to learn how to capture these gains and be in the stock before a huge gap or big run day, and improving the use of Bollinger Bands is the best method. Bollinger Bands are the best Channel Indicator for Technical Trading and for finding breakout compression candlestick patterns prior to gaps or runs.
See the chart example below.
LEARN MORE at TechniTrader.com
The ability of the bands to expand and contract makes them the ideal Channel Indicator to use. However, as with ALL Channel, Price, and Time Indicators, they require additional indicators as directional signals.
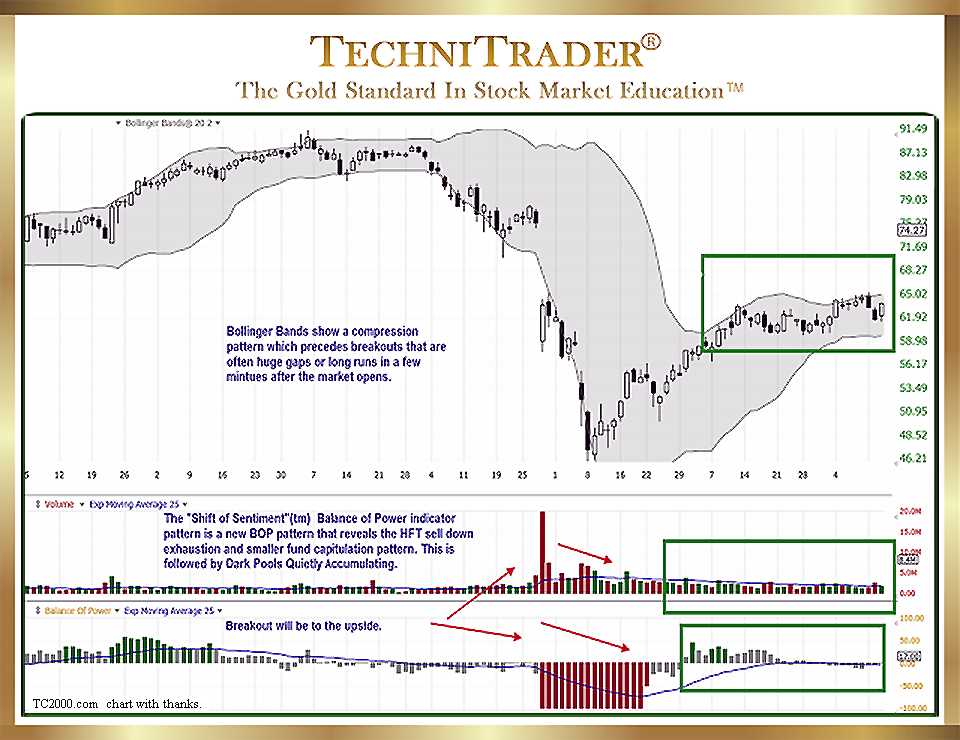
Bollinger Bands tell you that a stock is poised for a strong Momentum Run or Gap, but they do not tell you whether the Breakout will be to the Upside or the Downside.
During Trading Range Market Conditions, it is impossible to “guess” the Breakout direction solely using Price and Time Indicators.
Employing Quantity, stock Volume, or Flow of Funds Indicators provides the complete set of indicator analysis to determine the direction of the Breakout when using Bollinger Bands. The chart example above has stock Volume and Quantity Indicator windows below price.
When trading Options, this eliminates the need for Options strategies that buy both a Call and a Put because the trader has no idea what direction the Breakout will go.
When trading Stocks, it eliminates the risk of whipsaw action or just assuming that because the Indexes are down that the Breakout will also be down. This is especially helpful during Bottoming Market Conditions when stocks frequently retest prior bottom lows.
LEARN MORE at TechniTrader.com
The solution to How to Improve Bollinger Bands is to add Quantity, stock Volume, or Flow of Funds Indicators, and here are explanations of how and why that works:
- Quantity Indicators reveal the slow Dark Pool Quiet Rotation™, Dark Pool Quiet Distribution, and Dark Pool Quiet Accumulation patterns by the giant Buy Side Institutions. Balance of Power (BOP) in TC2000 with a Shift of Sentiment™ pattern reveals the exhaustion of selling followed by Dark Pool Quiet Accumulation, as shown in the chart example above. Quantity Indicators are regularly used by Professional Traders, but they are rarely used by Retail Traders. There are both line and histogram Quantity Indicators available.
- Volume Oscillator Indicators are also seldom used by Retail Traders. These offer a significant advantage over Price and Time Oscillators, which tend to give false signals during Momentum Runs, Velocity Runs, and other fast-moving price action that exceeds the parameters of the Price Oscillator scaling.
- The Flow of Funds Indicators are another group of indicators that help determine the direction of a Breakout. Oftentimes, Smaller Funds and Individual Investors are selling at the same time giant Buy Side Institutions are quietly buying the same stock hidden from view on Dark Pool venues. These types of indicators show whether money is flowing into or out of the stock.
By incorporating additional indicators into the stock analysis, Retail Traders and Technical Traders can significantly improve their trading profits by identifying the direction of the Breakout prior to price suddenly moving with momentum, a gap, or velocity action caused by High Frequency Trading triggers.
Summary
Quantity, stock Volume, and Flow of Funds Indicators are easy to interpret, provide the missing data for a complete stock pick analysis during sideways candlestick patterns, and are best for improving the use of Bollinger Bands.
For Options Traders, this is a far more useful analysis than traditional Options Indicators, and it can lower contract costs by providing the missing data needed to choose the proper contract and Option strategy. For further information about trading Options with a simple method and without using chains or the Greeks’ methods, watch the TechniTrader Trading Options for Beginners Webinar.
LEARN MORE at TechniTrader.com
If you have not yet begun to trade or invest, go to Introduction: Learn How to Trade Stocks – Free Video Lesson to get started.
Learn the steps to trade like a pro with this introductory mini course. You will learn what it takes to create a Professional Trading Plan that can help you achieve your trading goals: How to Create a Professional Trading Plan
Trade Wisely,
Martha Stokes CMT
TechniTrader technical analysis using a TC2000 chart, courtesy of Worden Bros.
Chartered Market Technician
Instructor & Developer of TechniTrader Stock & Option Courses
Copyright ©2017–2025 Decisions Unlimited, Inc. dba TechniTrader. All rights reserved.
TechniTrader is also a registered trademark of Decisions Unlimited, Inc.