
Why Use Compression Candlestick Pattern Indicator Analysis?
Add Quantity Indicators to Allow for Early Entry into Stocks
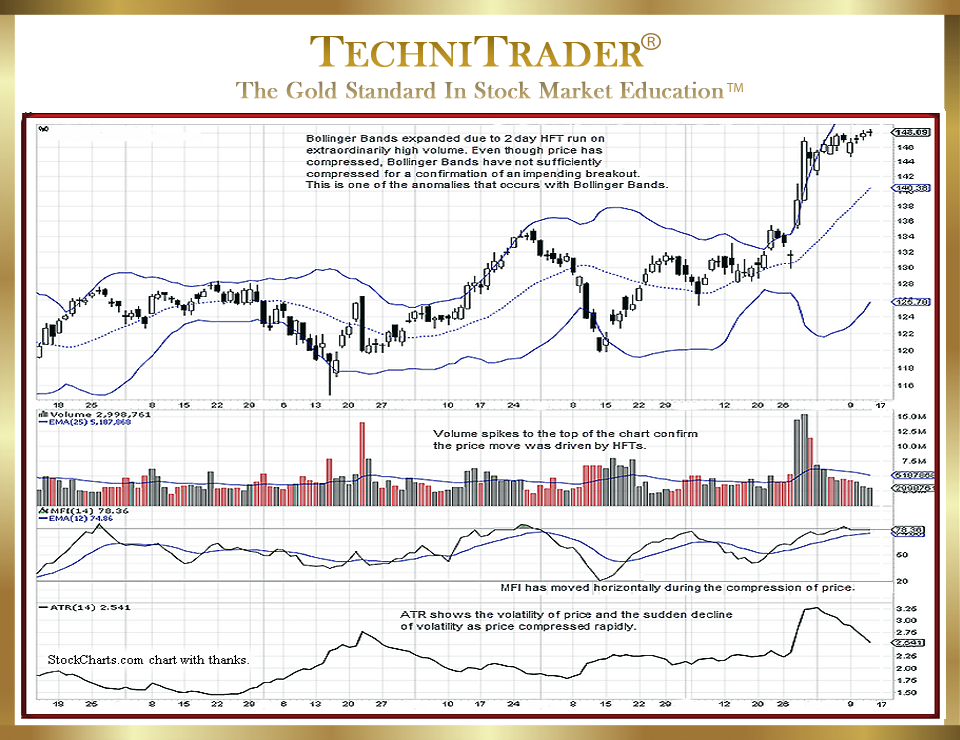
All indicators have limitations and Market Conditions where the indicator fails, does not provide a true positive or negative pattern, or is simply unable to keep up with the speed of momentum price or stock volume activity. Bollinger Bands® are no exception. Bollinger Bands and the various other indicators written by John Bollinger CFA, CMT are excellent indicators; however, all indicators have times when they lag behind price.
Both chart examples in this article are the same stock. See chart example #1 below.
LEARN MORE at TechniTrader.com
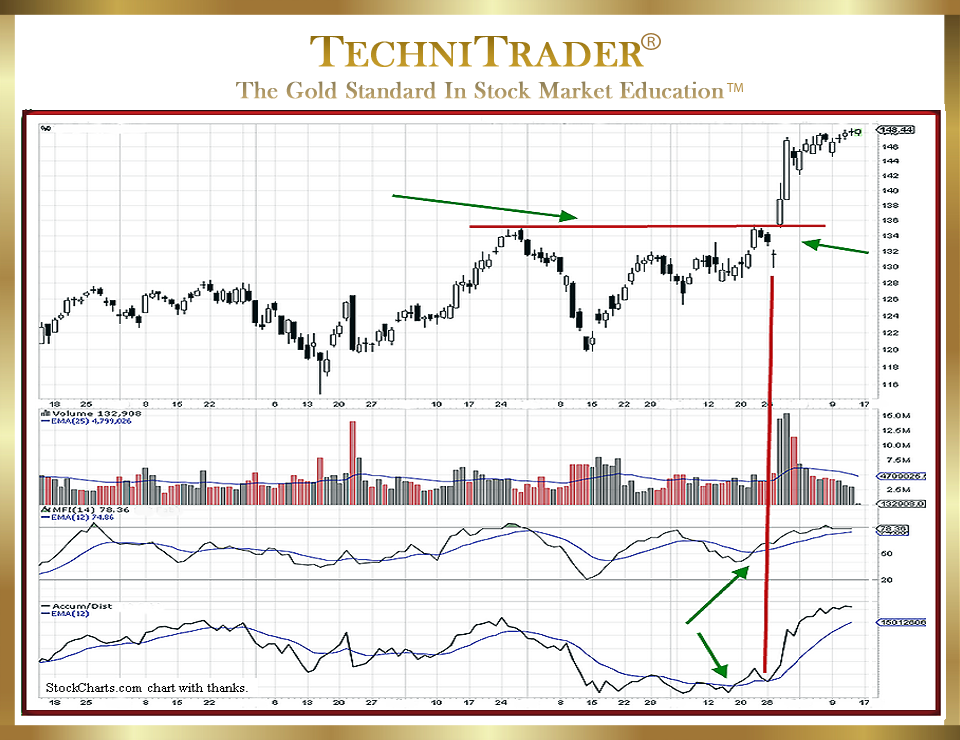
Adding Quantity Indicators to the analysis allowed for an early entry into this stock ahead of the High Frequency Trader (HFT) action. See chart example #2 below with the stock Volume, Money Flow Index (MFI), and Accum/Dist indicators.
LEARN MORE at TechniTrader.com
Tight compression candlestick patterns are indicative of a controlled buying pattern. The tighter the pattern, the sooner the breakout is likely to occur. Platforms and consolidations are generally the realm of the Dark Pool large and giant-lot institutions, either quietly accumulating or quietly distributing. Using Relational Technical Analysis™ to interpret what is going on by looking back in time to when the High Frequency Traders’ selling failed, it becomes obvious where the Dark Pools have entered this stock several times prior to the huge run. Although there is plenty of short-term profit taking by Professional Traders and Proprietary Traders, the stock is maintaining its price level. The Hybrid Indicators are flat rather than declining rapidly.
Lagging indicators are based solely on price and time data only, and they do not include quantity in the formulation. Price and Time Indicators are the bulk of indicators available to Retail Technical Traders. Therefore, it is important to always include Quantity and Time Indicators for chart analysis and the Hybrid Indicators which contain all 3 data streams in the formula.
Average True Range (ATR) is also a Price and Time Indicator, but it is an indicator designed specifically to expose volatility. Historical volatility exposes Options pricing volatility levels, and ATR can provide additional interpretation and analysis of the current price behavior.
Price behavior that is controlled and tightly contained within a set price with smaller candlesticks is common after a High Frequency Trader two-day run. High Frequency Traders generally run a stock in the first few minutes of the market open, and they rarely have two days in a row.
Summary
The common gap down in chart example #2 is the effort of Retail Traders trading the wrong side against the Dark Pools they can’t see. This immediately triggered pre-market morning buying from Dark Pools who are now using pre-market venues to enter ahead of any disruption from High Frequency Traders. The gap occurred at the beginning of the day. At the end of that day, Dark Pools entered the stock, causing the higher close for that day. The next day, High Frequency Traders gapped the price up.
Checking intraday for the past several days on a 30-minute chart reveals that profit taking is evident, but underlying hidden buying holds the price within a narrow range. Shift of Sentiment™ has developed beneath the visibility of Price and Time Indicators.
LEARN MORE at TechniTrader.com
If you have not yet begun to trade or invest, go to Introduction: Learn How to Trade Stocks – Free Video Lesson to get started.
Learn the steps to trade like a pro with this introductory mini course. You will learn what it takes to create a Professional Trading Plan that can help you achieve your trading goals: How to Create a Professional Trading Plan
Trade Wisely,
Martha Stokes CMT
TechniTrader technical analysis using StockCharts charts, courtesy of StockCharts.com
Chartered Market Technician
Instructor & Developer of TechniTrader Stock & Option Courses
Copyright ©2017–2026 Decisions Unlimited, Inc. dba TechniTrader. All rights reserved.
TechniTrader is also a registered trademark of Decisions Unlimited, Inc.