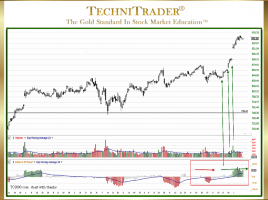
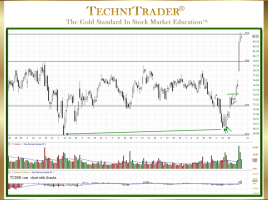
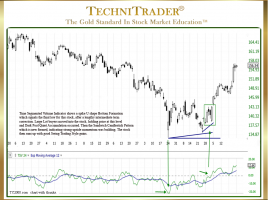
Currently browsing tag

Dark Pool Quiet Accumulation

Why Use Balance of Power to Find Dark Pools?

For Identifying Stocks Poised for Momentum Runs Balance of Power (BOP) is an extremely rare and unique indicator. Its origins come from the professional side of the market. It is designed to separate out large-lot activity from small-lot activity. This kind of stock volume aka quantity analysis on the tick-by-tick …

How to Use Balance of Power for Early Entry into Stocks

Shift of Sentiment™ Signals Momentum Energy Is About to Occur TC2000.com Users have a huge advantage over other Retail Traders as they have access to 3 of the most powerful indicators for the markets today which are automated with multi-venues for Stocks and Options. The complexity of the modern markets …

What Is the Anatomy of a Swing Trade?

Identifying Large Lots Dominating Buy Side or Sell Side of Momentum Run The most common mistake Retail Traders make in choosing stocks for Swing Trading is to not identify whether the large lots are dominating the buy side or the sell side during the price action momentum run upward. This …

How to Use Dark Pools for Higher Profits

Identify Quiet Accumulation Candlestick Pattern Before Stock Runs An area of Technical Analysis that has not made its way into most Stock Market books, articles, and information available on the internet is how to use Dark Pools for higher profits. The reason why Dark Pool technical patterns aka footprints are …

Why Does Time Segmented Volume Indicator Lead Price?

Has a Unique Cumulative Formula Rather Than Average-Based Time Segmented Volume (TSV) is a rare stock Volume Oscillator which provides leading indicator signals that are invaluable to short-term trading of stocks. Applicable styles of trading include Swing Trading, Momentum Trading, Position Trading, and Day Trading. As the Market Structure has …

Why Recognize MACD Contrarian Indicator Patterns?

Sideways Candlestick Pattern Breakout Direction Oftentimes, traders may be confused with conflicting indicator patterns. Contrarian patterns between indicators and between Price and stock Volume-based Indicators are very common these days. In the stock chart example below, the stock gapped up on earnings news and shifted to a sideways candlestick pattern …

3 pages