How to Distinguish Between a Market Correction and a Bear Market
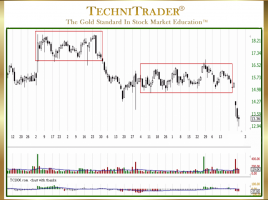
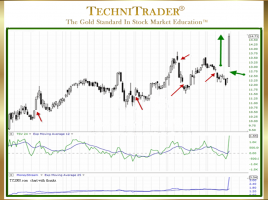
Use List for Technical Analysis of Candlestick Patterns The candlestick chart below is a good example of a Rounding Top Candlestick Pattern, which is the hardest of all the tops to see before it breaks to the downside, as they tend to do during a Market Correction. For Swing Trading, …