Currently browsing tag

volume

short_term_bottoms

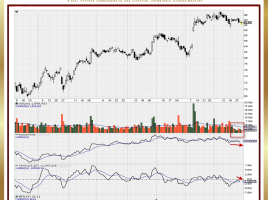
Anatomy of a Stock Bottom

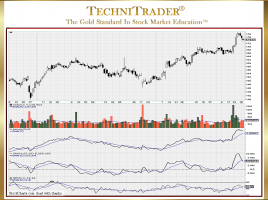
Candlestick Patterns and Large-Lot Indicators Short-term bottoms are often a sideways pattern that slowly rises out of the low. Sometimes it is hard to see this as a bottom developing, because price is moving in such a choppy up and down pattern each day. One great way to decide whether …

atr_indicator_in_stockcharts

Average True Range ATR Indicator Analysis

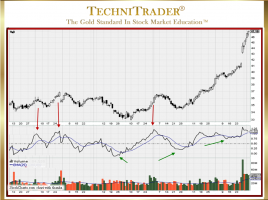
All About ATR Indicator in StockCharts ATR can be highly useful for technical traders who trade stocks, and stock or index options. It can work similarly to implied volatility and thus is particularly useful for options traders. ATR works on stocks, ETFs, and indexes providing valuable information about the magnitude …

tracking_quiet_accumulation

Tracking Institutional Investors

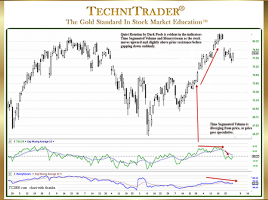
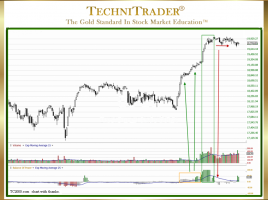
Quiet Accumulation/Distribution Indicators The task of finding a simple reliable method for tracking the quiet accumulation of institutional investors in the stock market was no small feat for me many years ago. Market indicators track mostly indexes, advancing versus declining stocks, breadth, and so on which all basically track price …

6 pages